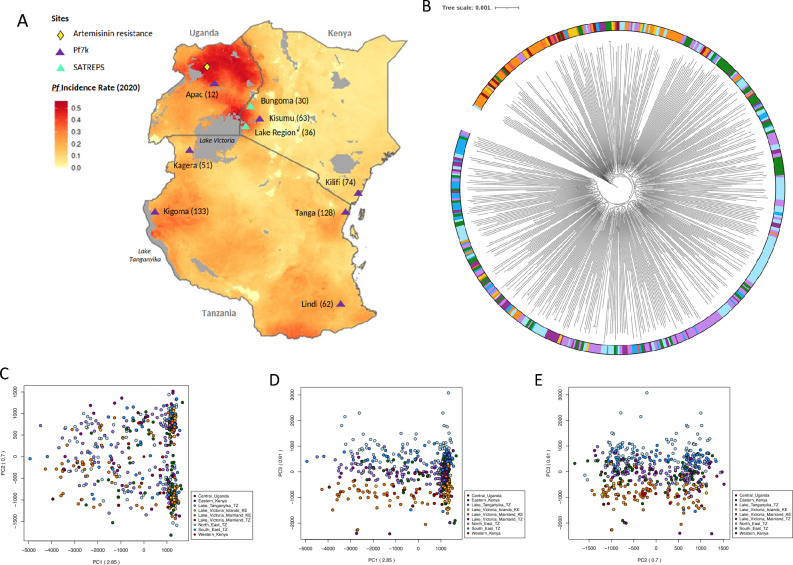
Figure 2.
Genomic structure of P. falciparum isolates from East Africa form subpopulations. (A) Heatmap of P. falciparum incidence rates in 2020 across Kenya, Tanzania and Uganda with sampling sites and artemisinin resistance locations annotated (generated using malariaAtlas R-software). (B) A maximum likelihood tree for 587 isolates from Central Uganda, Eastern Kenya, Lake Victoria, Lake Tanganyika, North East Tanzania, South East Tanzania, and Western Kenya, based on 710,552 high-quality genome-wide SNPs. (C, D, and E) Principal component analysis (PCA) of East African subpopulations, showing the separation of isolates in PCs 1, 2, and 3.

