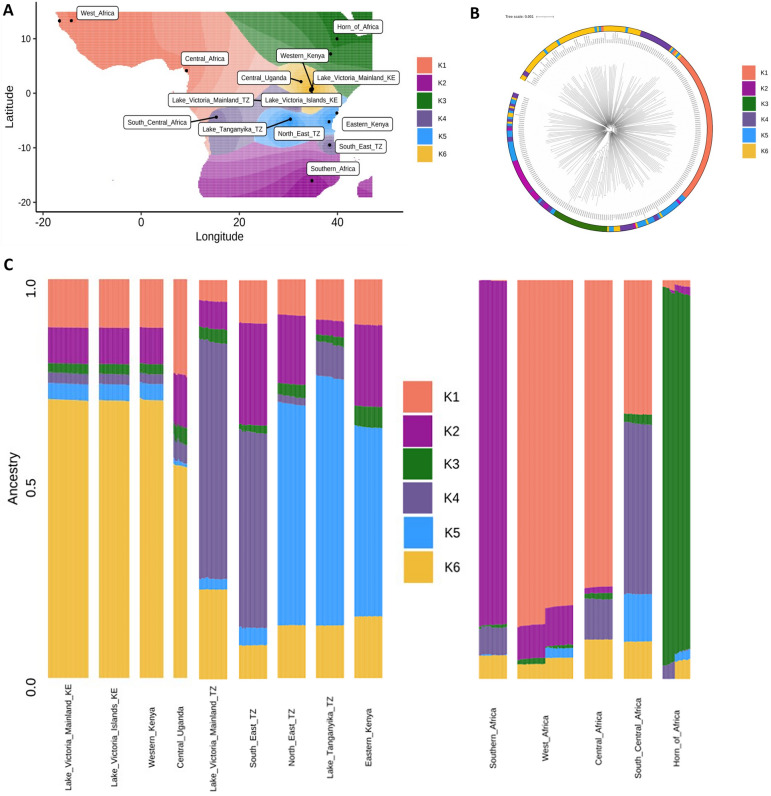
Figure 3.
Genome-wide ancestral admixture analysis of East African P. falciparum subpopulations and regional parasite populations from across Africa. (A) Geographic map displaying ancestry coefficients, where K is estimated to represent 6 distinct ancestral populations across Africa. (B) Maximum likelihood tree of 363 isolates, based on 640,596 genome-wide SNPs, coloured according to their predominant K proportion. (C) Barplot showing ancestry proportions for each isolate (rows) within each subpopulation (columns).

