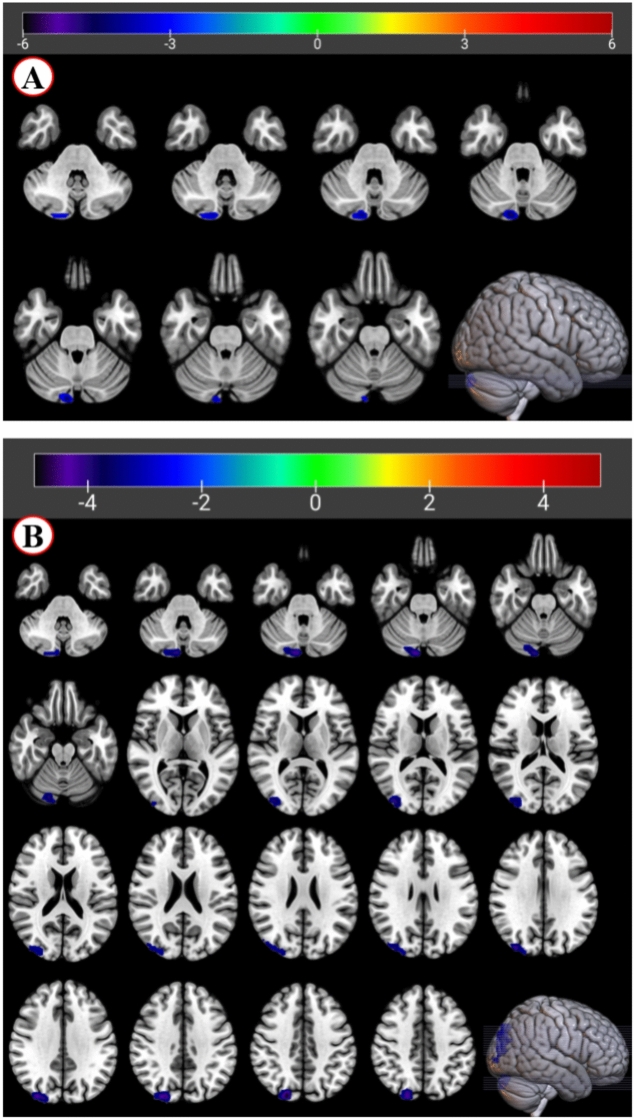
Figure 1.
fMRI shows brain regions with abnormal ALFF and ReHo values in the OCD group compared with the HC group. Note: voxel p < 0.001, cluster p < 0.05, FWE corrected. (A) Brain regions showing significant differences in ALFF values between the OCD and HC groups. The color bar represents the t-value range, with red indicating higher ALFF values in the OCD group and blue indicating lower ALFF values in the OCD group compared to the HC group. The ALFF of the OCD group was lower than that of HC in the Cerebellum_Crus2_R (MNI coordinates, 12, -87, -30). (B) Brain regions showing significant differences in ReHo values between the OCD and HC groups. The color bar represents the z-score range, with warm colors (yellow–red) indicating higher ReHo values in the OCD group and cool colors (blue) indicating lower ReHo values in the OCD group compared to the HC group. The ReHo of the OCD group was lower than that of HC in the Cerebellum_Crus2_R (MNI coordinates, 9, − 87, -30), and the Occipital_Sup_R (MNI coordinates, 21, − 84, 39).

