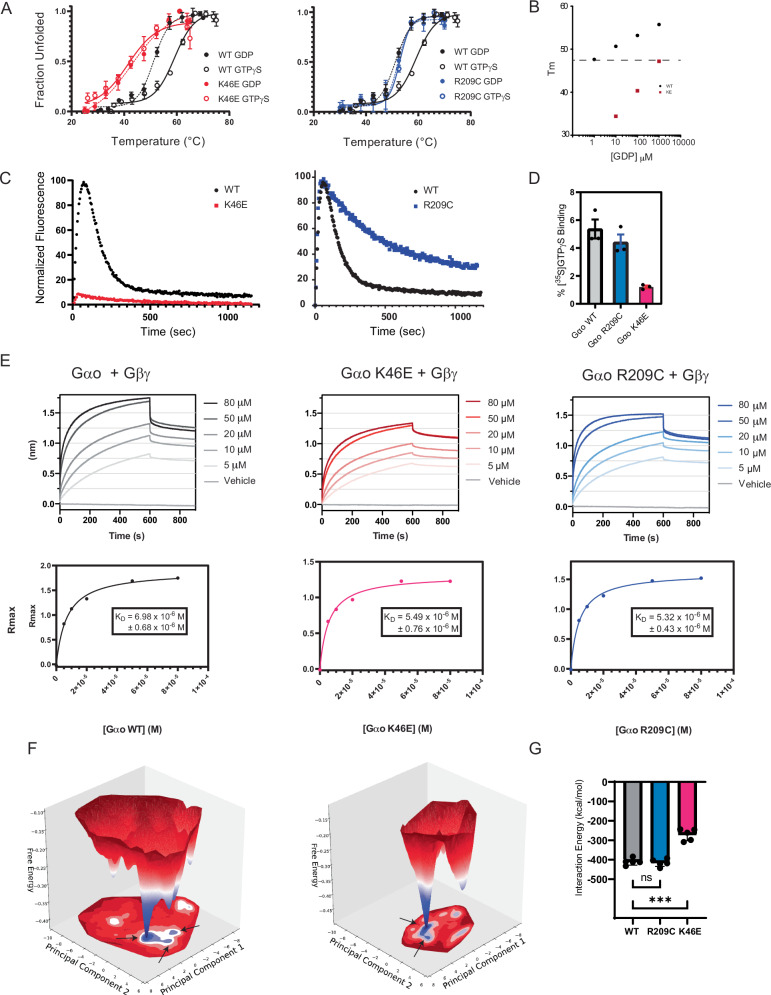
Fig. 4. The pinKE mutation preserves high affinity binding to Gβγ but not guanine nucleotides.
A Thermostability of purified Gαo (black), GαoK46E (red), and GαoR209C (blue) equilibrated in GTPγS (solid lines) or GDP (dashed lines). Tm values were quantified by fitting a two-state model of thermal unfolding. B Comparison Gαo and GαoK46E binding (Tm) to GDP. C Combination of purified Gαo, GαoK46E, and GαoR209C with BODIPY-GTP to monitor binding (increase in fluorescence) and hydrolysis (decrease in fluorescence). Normalized fluorescence, defined as percentage of maximum signal after subtracting the starting signal, for each experimental run. D Percent Gαo bound to GTPγ[35S] determined using the ratio of the measured activity per sample (cpm/pmol Gαo) to the average total specific activity of 35S added to each sample (cpm/pmol). E Purified biotinylated Gβ and Gγ immobilized on streptavidin were combined with the indicated concentration of purified Gαo (left), GαoK46E (middle), and GαoR209C (right). Binding is reported as a shift in the interference pattern (nanometers, nm). Rmax, defined as the absolute signal in nm after subtracting the starting (buffer) control. F Free energy surface of Gαo-apo system (left) and GαoK46E -apo system (right). Shown are representative structures from the local minima indicated by arrows on the free energy surface. G Interaction energy of GTP with proteins in the Gαo-GTP, GαoR209C-GTP, and GαoK46E -GTP systems. Data in A and D are means ± SEM, from 3 independent experiments, 3 measurements each. Data in B are means of 2 independent experiments. Data in C are representative of 3 or more independent experiments. Data in E are representative of 2 independent experiments, 2 measurements each. Data in G are means ± SEM, from 5 independent experiments; ***p = 0.0003. Source data are provided as a Source Data file.

