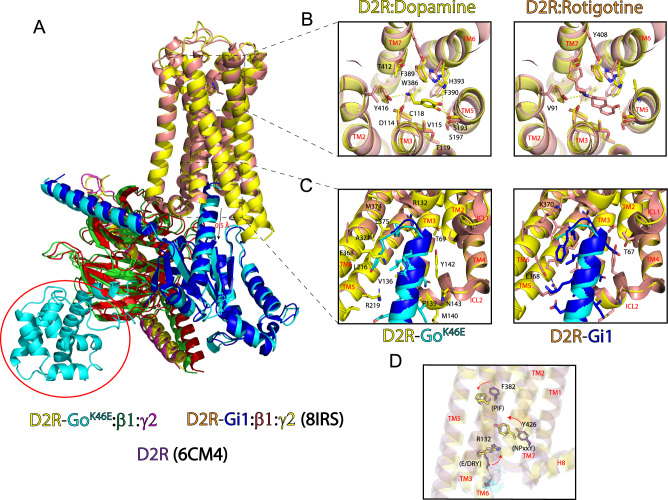
Fig. 6. Structural comparison of D2R-GoK46E with D2R-Gi1 reveals conserved features.
A Superposition of D2R-Go K46E bound with dopamine and D2R-Gi1 bound with rotigotine (PDB ID: 8IRS) reveals an RMSD of 1.50 Å between the two receptors. GαοK46E is shifted downward approximately 0.5 Å relative to Gαο. B Top-down view of the extracellular region and orthosteric binding sites of D2R-Go K46E and D2R-Gi1. Stick figures are residues that interact with either dopamine or rotigotine. Yellow distance lines are <4 Å. Stick figures of residues and bound ligand correspond to the receptor complex. Left panel, stick figures are shared residues; right panel, residues specific for rotigotine. TMs are labeled in red. C Comparison of intracellular region of D2R-GoK46E and D2R-Gi1. Stick figures are interacting residues from D2R and the respective G protein C-terminal tails. Stick figures of residues correspond to the receptor complex. Left panel, stick figures of shared residues; right panel, additional residues specific for Gi1. TMs and intracellular loops (ICLs) are labeled in red. D Structural comparison of GPCR activation motifs in the D2R inactivate state (PDB ID: 6CM4) and those of D2R-GoK46E and D2R-Gi1. Stick figures, key residues in the PIF, E/DRY, and NPxxY activation motifs. Arrows, direction of movement in going from the inactive to the active state. Coloring is consistent with the corresponding D2R.

