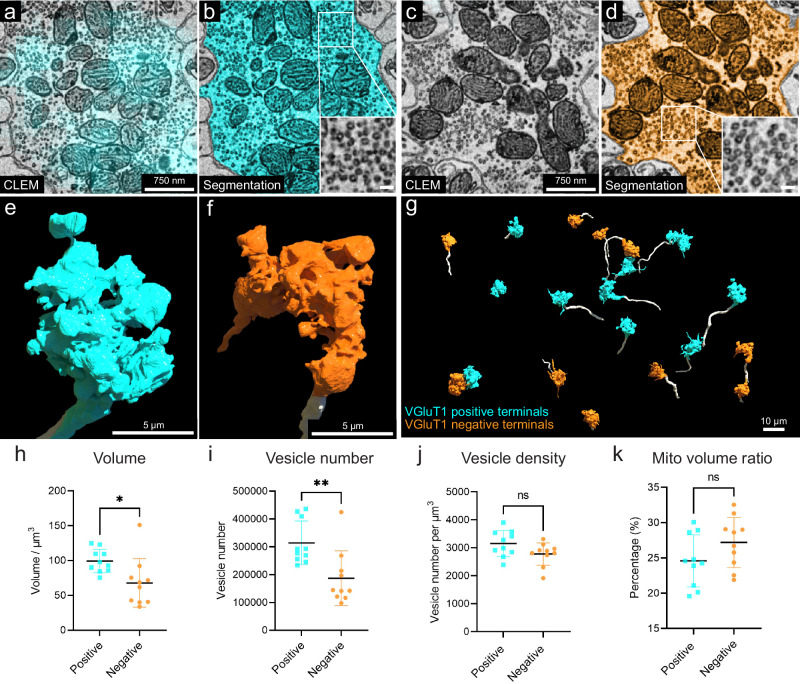
Fig. 7. 3D reconstruction and analysis of VGluT1-positive and -negative mossy fiber terminals based on labeling with the VGluT1-specific scFv probe.
a Representative 2D CLEM image showing the fluorescence signals (cyan) of the VGluT1-specific scFv probe overlapping with a mossy fiber terminal (n = 10). b EM image showing the 2D segmentation (cyan) of the mossy fiber terminal labeled in (a) (n = 1). The enlarged inset shows the morphology of synaptic vesicles in this terminal. c Representative 2D CLEM image showing a mossy fiber terminal lacking VGluT1 fluorescence signal (n = 10). d EM image showing the 2D segmentation (orange) of the mossy fiber terminal labeled in (c) (n = 1). The enlarged inset shows the morphology of synaptic vesicles in this terminal. e 3D reconstruction of the VGLUT1-positive mossy fiber terminal (cyan) in (b). The axon leading to the terminal arises from the bottom of the panel. f 3D reconstruction of the VGluT1-negative mossy fiber terminal (orange) in (c). The axon leading to the terminal arises from the bottom of the panel. g 3D reconstruction of ten VGluT1-positive mossy fiber terminals (cyan) and ten VGluT1-negative mossy fiber terminals (orange). The axons are labeled in white. h Volume, i vesicle number, j vesicle density, k mitochondria volume ratio per terminal volume were measured for each of the 10 VGluT1-positive terminals (n = 10), cyan, and the 10 VGluT1-negative terminals (n = 10), orange. Mean values with SD are shown on each graph. Two-sided unpaired t test was performed. For volume (h), P = 0.0191; P < 0.05; t = 2.575, df = 18; For vesicle number (i), P = 0.0050; P < 0.01; t = 3.200, df = 18; For vesicle density (j), P = 0.0705; P < 0.1; t = 1.922, df = 18; For mitochondria volume ratio (k), P = 0.1285; P > 0.1; t = 1.593, df = 18. Mito mitochondria. n indicates example. Source data are provided as a Source Data file.

