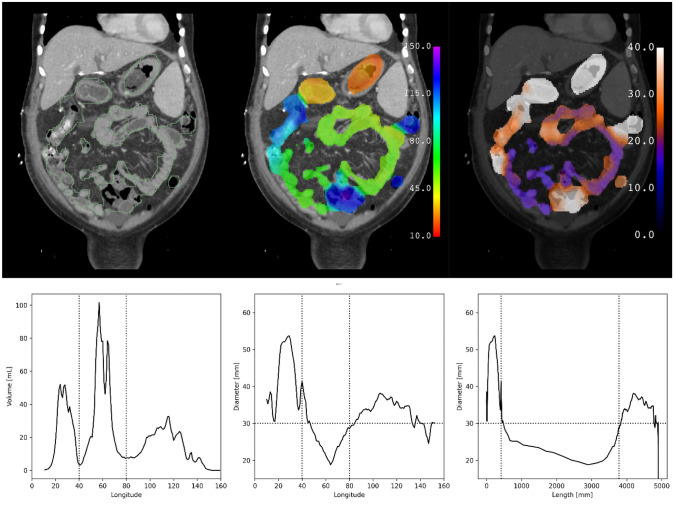
Fig. 3.
Test subject with no bowel obstruction. Segmentation (green outline), longitude (rainbow), and diameter (hot metal blue) predictions superimposed on a coronal slice of a CT scan of a subject from the test data set with no bowel obstruction. Graphical representations of volume and diameter (averaged over 1 unit intervals of longitude) versus longitude and length are shown for the same subject. Vertical dotted lines indicate the ligament of Treitz and ileocecal valve. Horizontal dotted line indicates the threshold for small bowel obstruction. No small bowel dilation and no transition point are present

