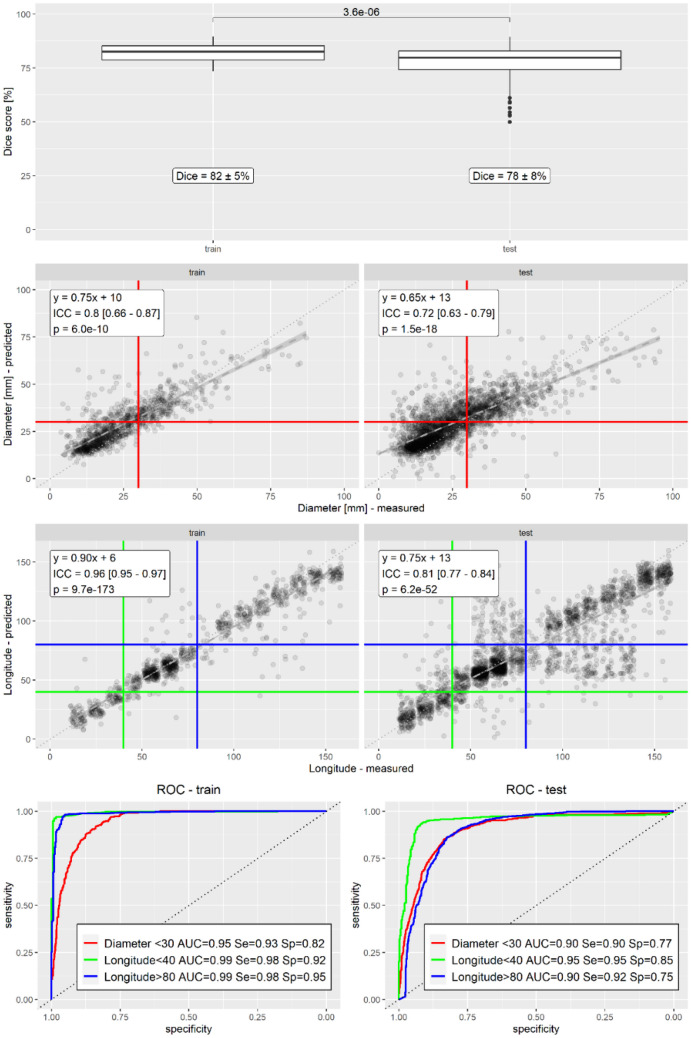
Fig. 7.
Statistical analysis. Dice scores were calculated between manual and predicted segmentations. The p-value of a t-test between Dice scores of the training and test data sets is also shown. Intraclass correlations were calculated between manual and predicted values for diameters and longitudes. The equation of the best linear fit and thresholds used for ROC analysis are also shown. The longitude scatterplot is made with jitter to avoid superimposition of presumed longitudes. ROC curves and AUROCs were calculated using thresholds of 30 mm for diameter, and 40 and 80 for longitude. Sensitivity and specificity are shown using the same thresholds for predictions as measurements. Each statistic was calculated for the training and test data sets separately

