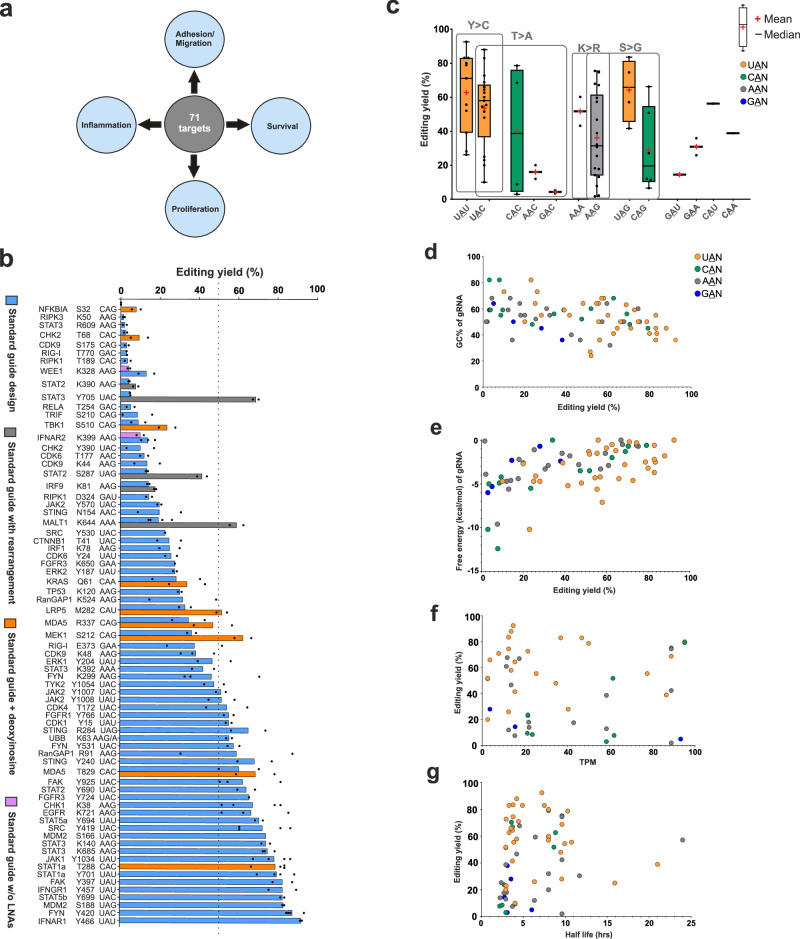
Fig. 3. Unbiased PTM interference screen with RNA base editing.
a Various signaling cues related to essential biological processes represent attractive targets for doseable and transient manipulation by RNA base editing. b 70 + PTM sites (Y > C, K > R, S > G, T > A, etc.) on various endogenous signaling transcripts have been targeted in HeLa-PB-SA1Q cells using 2 pmol (per 96-well with 150 µl total volume) of the improved standard guide RNA design (5′−3 + 9 + C + 12 nt, 4 LNAs, BisBG) or variation thereof as indicated. c–g Analysis of effects of various parameters on RNA base editing efficiency. Mean editing yields (N = 2) of 70+ targets plotted against target codon (c), GC content of the guide RNA calculated with Oligo Calc44 (d), minimum free energy of guide RNA hairpin folding secondary structure calculated with NUPACK45 (e), relative gene expression level (mean TPM values of genes in Hela PB SA1Q cells with 48 h dox induced SA1Q expression (f). Half-life of the transcript, taken from42. In panels c-g, the color code indicates the nucleotide 5′ to the edited adenosine. Data in panel b is shown as the mean of N = 2 independent experiments in most cases and N = 3 or 4 in some cases, individual data points are given. In panel c, the box represents the interquartile range showing the middle 50% of the data points. The ends of upper or lower T-shaped whiskers extend to the maximum or minimum data point which is still within 1.5 times the interquartile range. Source data are provided as a Source Data file.

