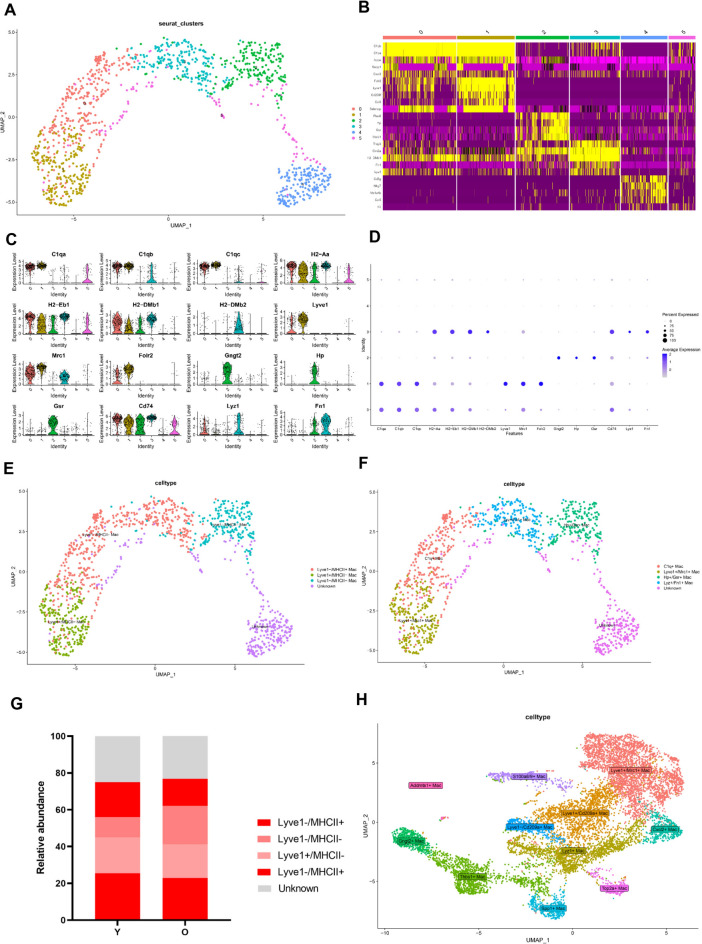
Figure 2.
Subclusters of macrophages and marker genes of each cluster in mice SkM. (A) The UMAP plot of the six identified clusters. (B) The heatmap, violin plot (C) and the dot plot (D) showing the representative markers across six clusters. (E) The UMAP plot illustrating the macrophages subgroups based on the Lyve1/MHCII expression levels and (F) their marker genes. (G) The relative abundance of macrophages subgroups in young and old mice SkM based on Lyve1/MHCII classification. (H) The UMAP plot representing 11 distinct SkM macrophages subgroups based on marker genes in GSE195507.

