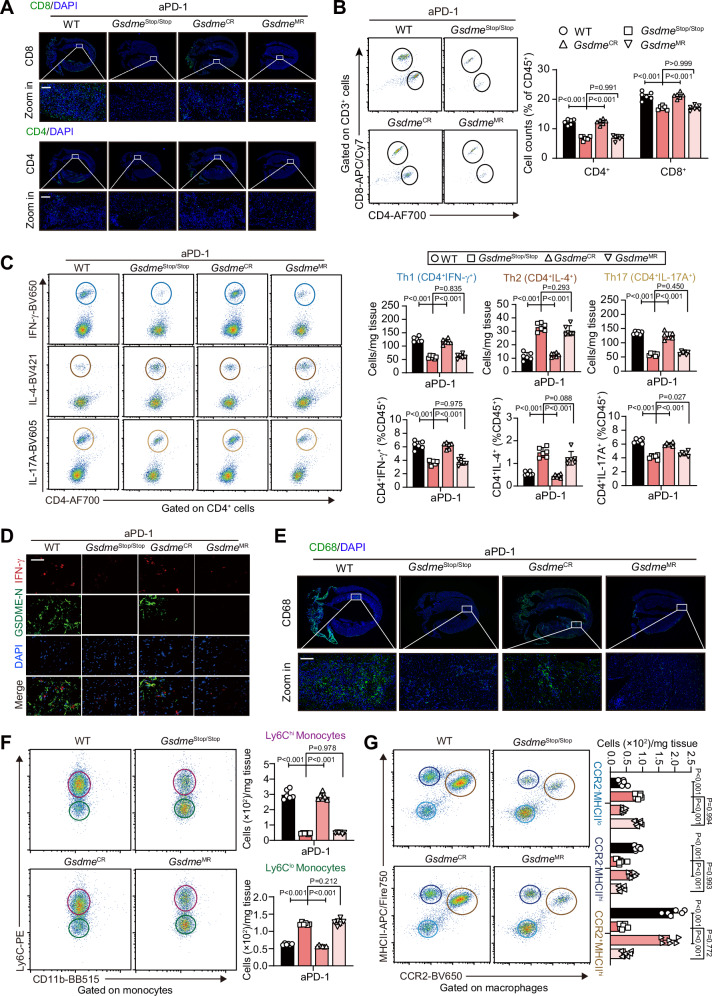
Fig. 8. Rescue of GSDME in cardiomyocytes but not in myeloid cells replicates aPD-1 therapy-induced cardiac immune cells infiltration and inflammation.
A Representative fluorescent immunohistochemistry staining of CD8 and CD4 and amplified images in whole heart section of WT, GsdmeStop/Stop, GsdmeCR and GsdmeMR mice received aPD-1 therapy. The infiltrated CD8+ and CD4+ T-cells were obviously noted in the myocardium of WT and GsdmeCR mice, which were partially inhibited in GsdmeStop/Stop and GsdmeMR mice. Scale bar, 100 μm. B Representative flow cytometry and quantitative analysis of CD4+ and CD8+ cells in heart of WT, GsdmeStop/Stop, GsdmeCR and GsdmeMR mice received aPD-1 therapy. C Proportions of Th1 (IFN-γ+), Th2 (IL-4+) and Th17 (IL-17A+) cells within CD4+ T-cells in hearts of WT, GsdmeStop/Stop, GsdmeCR and GsdmeMR mice received aPD-1 therapy. D Double-fluorescent immunohistochemistry of IFN-γ and GSDME-N in heart of WT, GsdmeStop/Stop, GsdmeCR and GsdmeMR mice received aPD-1 therapy. DAPI was used to stain nuclei. Scale bar, 50 μm. E Representative fluorescent immunohistochemistry staining of CD68 and amplified images in whole heart section of WT, GsdmeStop/Stop, GsdmeCR and GsdmeMR mice received aPD-1 therapy. The infiltrated CD68+ MOs/MPs were obviously noted in the myocardium of WT and GsdmeCR mice, which were partially inhibited in GsdmeStop/Stop and GsdmeMR mice. Scale bar, 100 μm. F Representative flow cytometry plots and quantitative analysis of Ly6ChiCD11b+ and Ly6CloCD11b+ monocytes in heart of WT, GsdmeStop/Stop, GsdmeCR and GsdmeMR mice received aPD-1 therapy. G Representative flow cytometry plots and quantitative analysis of CCR2−MHC-IIlo, CCR2−MHC-IIhi and CCR2+MHC-IIhi macrophages in heart of WT, GsdmeStop/Stop, GsdmeCR and GsdmeMR mice received aPD-1 therapy. The data were presented as means ± SEM and analyzed by One-Way ANOVA followed by Tukey post-hoc test. n = 6 biologically independent experiments.

