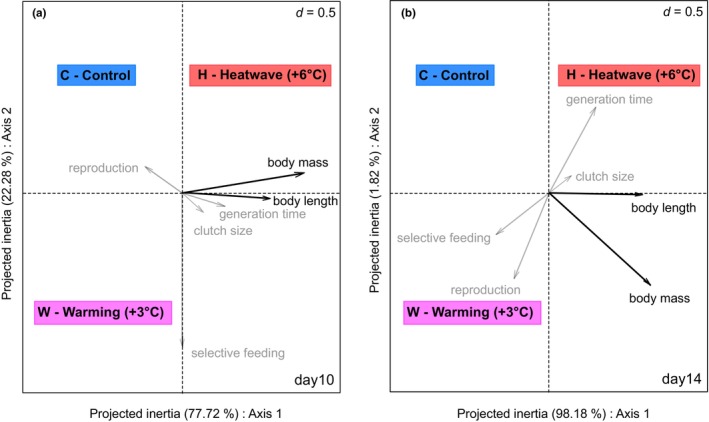
FIGURE 2.

RLQ plots for the relationships between zooplankton traits and experimental treatments after the first heatwave on days 10 (a) and 14 (b). Traits having at least one significant (p < .05) relationship with at least one treatment based on fourth‐corner analyses are shown with black arrows, while others are in gray. (Grid size: D = 0.5).
