
FIGURE 3.
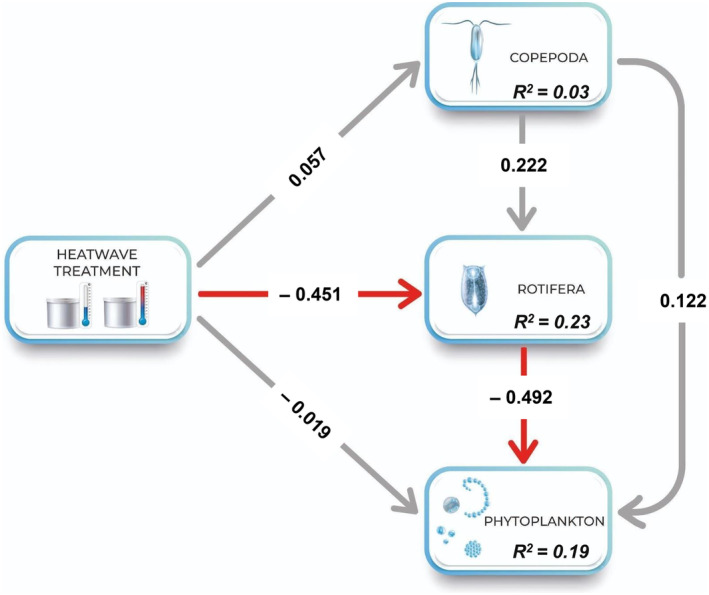
A structural equation model (SEM) of the linkages between the dominant zooplankton groups, Rotifera and Copepoda (biomass), and phytoplankton (Chla fluorescence) in the heatwave treatment during the first 2 weeks of the experiment. The model presented here is based on a time lag of 4 days between Chla and zooplankton when the marginal R2 shows the highest value among the time lags. Solid red arrows represent direct, significantly negative pathways (p < .05), while gray arrows stand for non‐significant direct pathways. Numbers represent standardized parameter estimates. Marginal R2s for component models are given in the boxes of endogenous variables. The amount of variation explained by the model (along with others with different time lags) is presented in Table S4 and Figure S14.