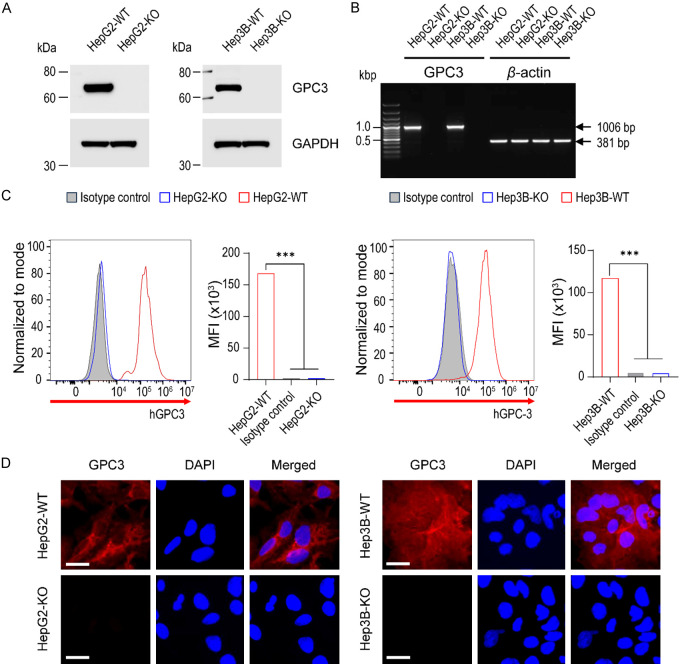
Figure 2.
Confirmation of GPC3 knockout at the transcriptional and translational level. A. Western blots of cell lysates extracted from parental and GPC3-KO cells. Endogenous GPC3 protein was detected by the protein-specific antibody in parental cells, whereas protein loss was confirmed in the KO cells. GAPDH was used as the internal control. B. RT-PCR analysis of parental and GPC3 knockout HepG2 and Hep3B cell lines. Successful knockout of the GPC3 gene was confirmed in the KO cell lines. Beta-actin was used as the internal control. C. Analytical flow cytometry of surface GPC3 expression on parental and GPC3-KO cells. Parental HepG2 and Hep3B cells (red line) expressed GPC3, while KO cells (blue line) lacked intact GPC3 expression. Data are presented as the mean fluorescence intensity (MFI). Mouse immunoglobulin G1 (IgG1, grey-filled area) served as the isotype control. Differences in MFI were statistically tested using ANOVA. ***, P<0.001. D. Immunofluorescence staining with GPC3 (in red) and DAPI (in blue) on parental and GPC3 knockout HepG2 and Hep3B cells. Highly expressed GPC3 in parental cells was completely knocked out in HepG2 and HepG2-KO clones. The bottom panel shows immunofluorescence with the isotype negative control. Scale bars are shown for 20 µm.

