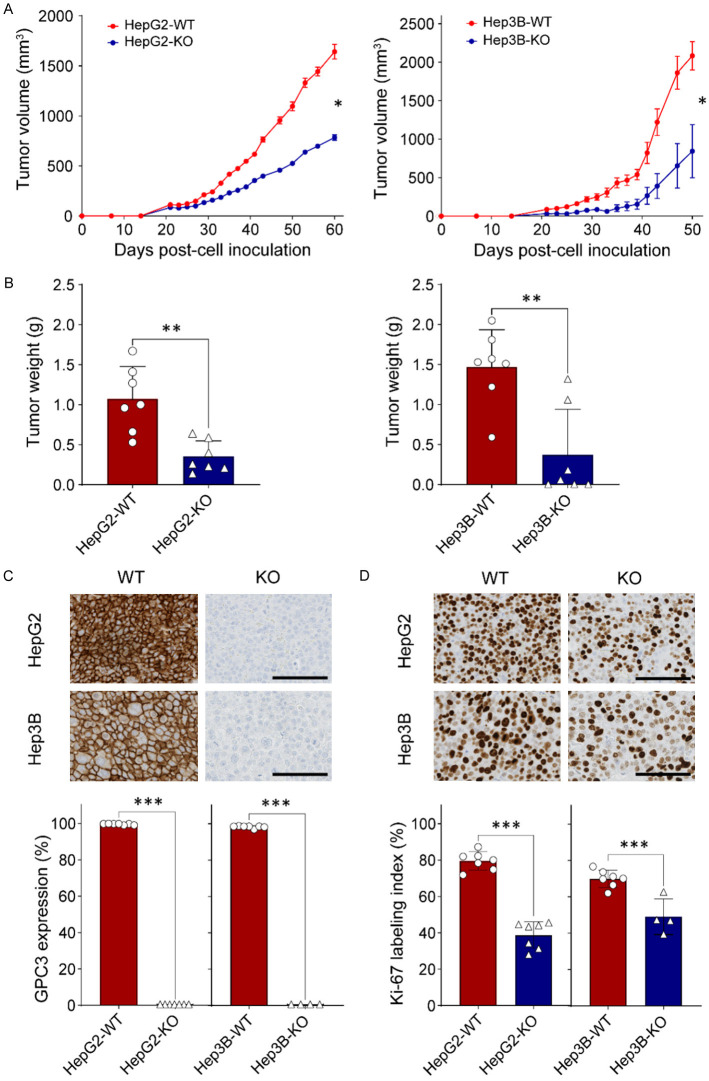
Figure 4.
Impact of GPC3 deficiency in liver cancer cells in a xenograft mouse model. A. Comparison of in vivo tumor growth between parental and GPC3 knockout (KO) cells. Five million parental (HepG2 & Hep3B) and GPC3-KO cells were subcutaneously inoculated into BALB/c athymic nu/nu mice, with each group comprising n=7 mice. The values represent the mean ± standard error (SE). B. Tumor weights of xenograft tumors derived from wild-type HepG2, GPC3-KO HepG2, wild-type Hep3B, and GPC3-KO Hep3B cells. The data represents the mean ± standard deviation (SD). C. Immunohistochemical staining for GPC3 in xenograft tumor tissues. Digital analysis using Visiopharm software categorized staining intensity as negative or positive based on intensity. The final score was calculated as the mean positive ratio from six randomly selected different regions of the tumor section. D. Immunohistochemical staining for Ki-67 in xenograft tumor tissues. The Ki-67 expression index represents the mean percentage of positively stained cells from six representative regions of the xenograft tumor section. The data represent the mean ± SD. Statistical significance in experimental values was determined using the t-test. *, P<0.05; ***, P<0.001.

