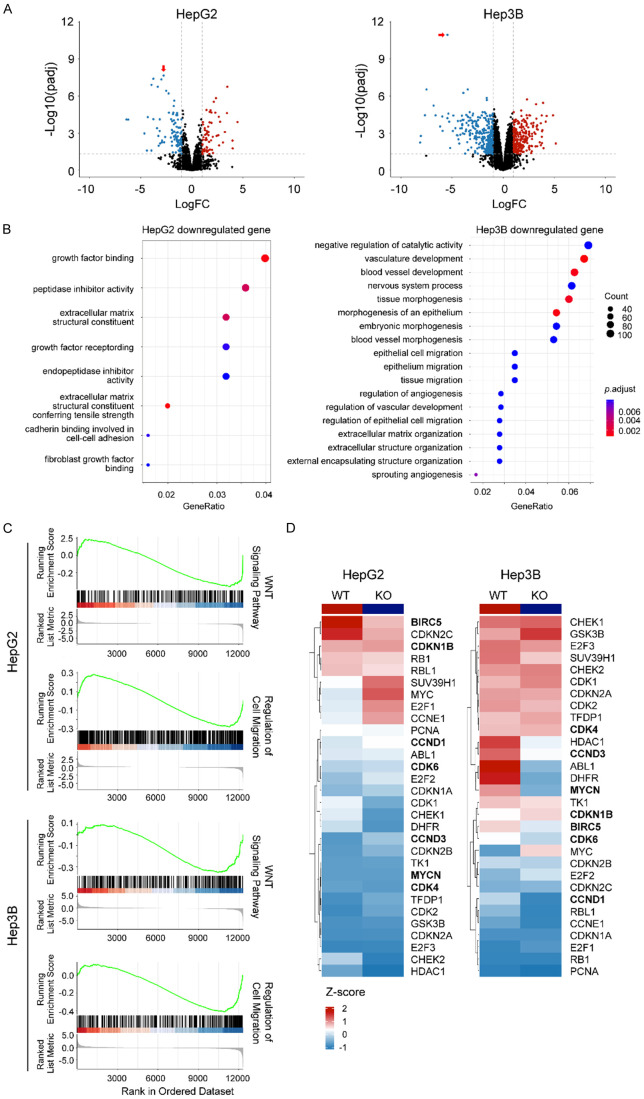
Figure 5.
Transcriptional effects of GPC3 knockout in HepG2 and Hep3B cells. A. Volcano plot showing differential gene expression upon GPC3 knockout using CRISPR/Cas9 in HepG2 and Hep3B cell lines. Plot depicts log2 fold change vs. -log10 False discovery-corrected p-value (FDR) for individual genes. Downregulated genes are represented in blue and upregulated genes are represented in red. GPC3 is represented with red arrow. B. Plot showing enriched KEGG pathway and gene ontology, biological process (GO BP) terms in genes downregulated upon GPC3 knockout, relative to parental liver cancer cell lines. Gene ratio indicates proportion of the GO/KEGG term containing query genes, dot size indicates number of query genes in the GO term, and color indicates the false-discovery rate corrected/adjusted p-value. C. Gene set enrichment analysis (GSEA) of RNA sequencing data from HepG2 and Hep3B cells with GPC3-KO. Results show representative GSEA plots and tables of top enriched GO BP gene sets downregulated in GPC3-KO cells. D. Heatmap representation of cell cycle related genes upon GPC3-KO.

