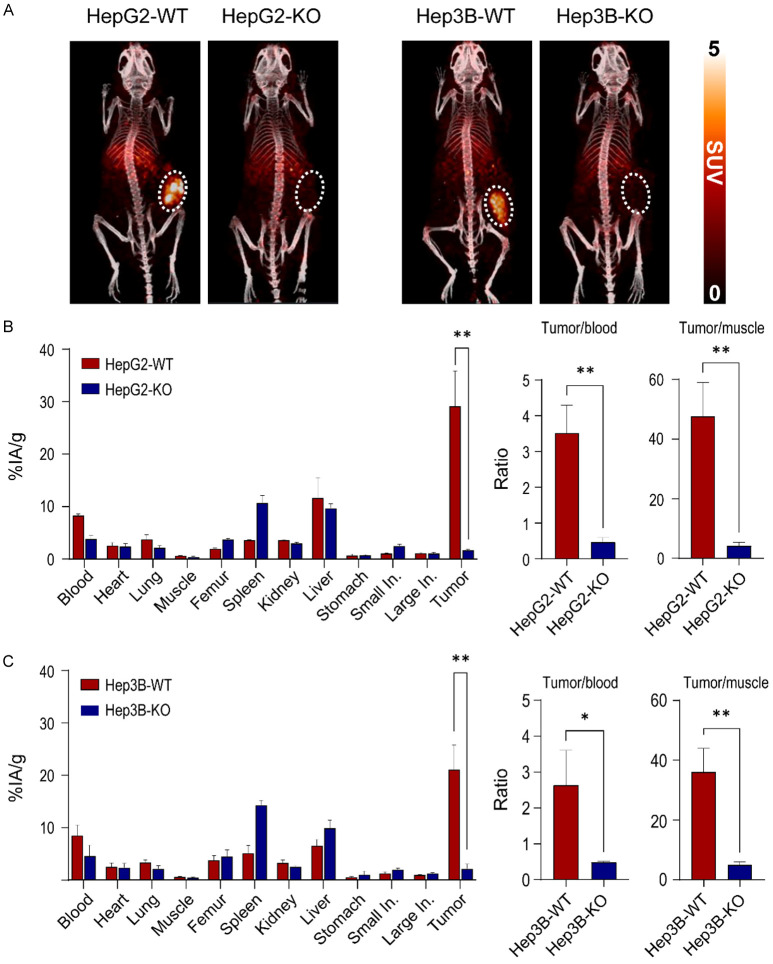
Figure 7.
Validation of GPC3 knockout by GPC3-targeted immunoPET imaging and biodistribution in xenograft models. A. Representative MIP-PET/CT images of 89Zr-DFO-GC33 in HepG2 xenografts (WT and KO) and Hep3B xenografts (WT and KO) at 72 h post-injection (n=3, respectively). The tumor is indicated by white dotted circles. PET images display radioactivity calibrated in standardized uptake values (SUV). B. Biodistribution data of 89Zr-DFO-GC33 in the major organs of HepG2-WT and HepG2-KO xenografts at 72 h post-injection. Comparison of tumor-to-blood ratio and tumor-to-muscle ratio of 89Zr-DFO-GC33 at 72 h post-injection between HepG2-WT and HepG2-KO xenografts. Data are present as the mean ± SD (n=3, respectively). C. Biodistribution data of 89Zr-DFO-GC33 in the major organs of Hep3B-WT and Hep3B-KO xenografts at 72 h post-injection. Comparison of tumor-to-blood ratio and tumor-to-muscle ratio of 89Zr-DFO-GC33 at 72 h post-injection between Hep3B-WT and Hep3B-KO xenografts. Data are presented as the mean ± SD (n=3, respectively). Radioactivity uptakes in biodistribution were calculated as the percentage of the injected activity per gram of tissue (%IA/g). Statistical significance in biodistribution data and tumor-to-organ ratio calculation was determined by the t-test. A p-values of <0.05 was considered statistically significant: *, P<0.05; **, P<0.01.

