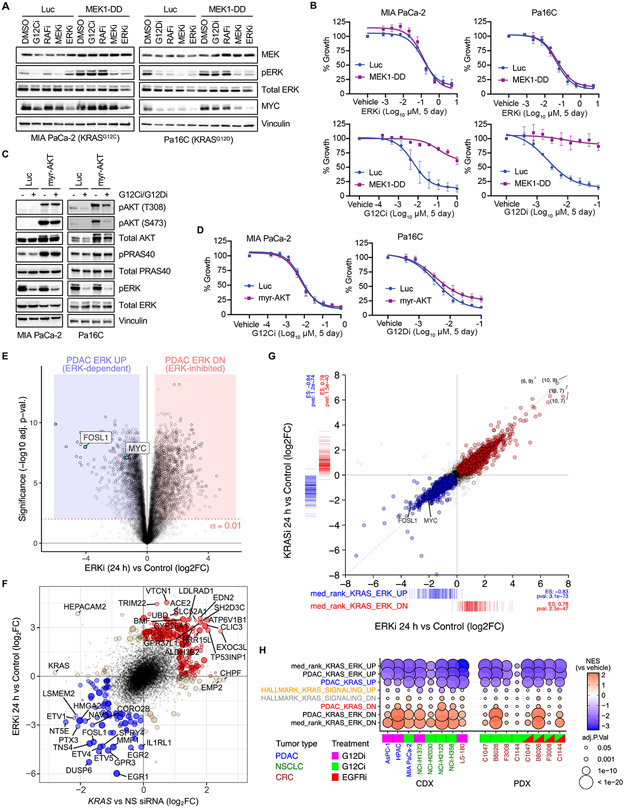
Fig. 2. Mutant KRAS is largely dependent on ERK for PDAC proliferation in vitro.
(A) Immunoblot analysis of ERK activity in PDAC cell lines stably infected with control vector (Luc) or constitutively activated MEK1 (MEK1-DD), treated with vehicle (DMSO) or indicated inhibitors of each level of the RAF-MEK-ERK cascade (G12Ci/G12Di, MRTX1257/MRTX1133 (20 nM); RAFi, LY3009120 (600 nM); MEKi, trametinib (6 nM); ERKi, SCH772984 (600 nM). Images are representative of 2-3 biological replicates. (B) Growth of PDAC cells stably infected with control vector (Luc) or activated MEK1-DD and treated with the indicated inhibitors. Error bars indicate SE of the mean with 3-4 biological replicates, each with three technical replicates. (C) Immunoblot analysis of ERK and AKT phosphorylation in PDAC cells stably infected with control vector (Luc) or constitutively activated AKT (myr-AKT), treated with G12Ci/G12Di (MRTX1257/MRTX1133, 20 nM) or ERKi (SCH772984, 600 nM). Representative of 2-3 biological replicates. (D) Growth of PDAC cells expressing activated AKT or control vector (Luc) and treated with KRAS G12C/D inhibitors. Error bars indicate SE of the mean with 3-4 biological replicates, each with 3 technical replicates. (E) Differential gene expression analysis for seven PDAC cell lines subjected to ERKi (SCH772984, 1000 nM) treatment for 24 hours versus paired untreated control cells. (F) Top 200 UP/DN genes from 24 hours KRAS siRNA and ERKi RNA-seq experiments are shown as filled blue (UP) or red (DN) circles, with a positive predictive value (agreement/total) for logFC = 0.84. Genes with strongest logFC values (n = 40) are labeled. (G) Evaluation of DE genes following 100 nM treatment of Pa16C PDAC cells with KRASi-G12Di (MRTX1133) or ERKi (SCH772984) for 24 hours (each condition, n = 2). Colored points are DE genes in either treatment (FDR < 0.05); red, log2FC > 0 with either treatment; blue, log2FC < 0 with either treatment; tan, log2FC opposite directions between treatments. Coordinate labels indicate points outside of plotting range. Barcode plots below and left represent log2FC for “median rank KRAS-ERK” signature genes within each experiment and ssGSEA enrichment statistics. (H) GSEA for PDAC KRAS UP/DN, PDAC KRAS-ERK UP/DN, and KRAS-ERK UP/DN based on median rank, along with Hallmark KRAS Signaling signatures in CDX and PDX models treated with G12Di, G12Ci or G12Ci+EGFRi with replicates as described in Fig. 1E. Inhibitors used in (H): G12Ci (CDX), adagrasib; G12Di, MRTX1133; G12Ci (PDX), sotorasib; EGFRi, panitumumab.

