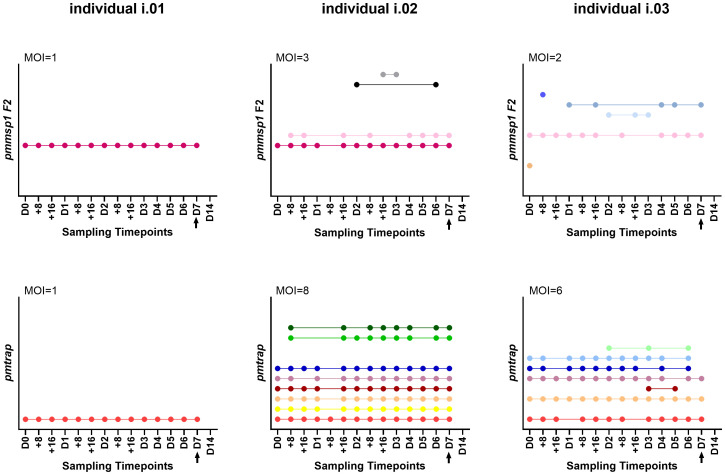
Figure 3.
Three individuals i.01, i.02 and i.03 were genotyped at 15 timepoints using the markers pmmsp1 F2 (upper row) and pmtrap (lower row). Each color represents a different genotype for the respective marker. The arrow indicates treatment with artemether-lumefantrine on day 7. The remaining 18 individuals are shown in Supplementary Figure S2 . MOI, multiplicity of infection, referring to the maximum MOI measured among the 15 timepoints.

