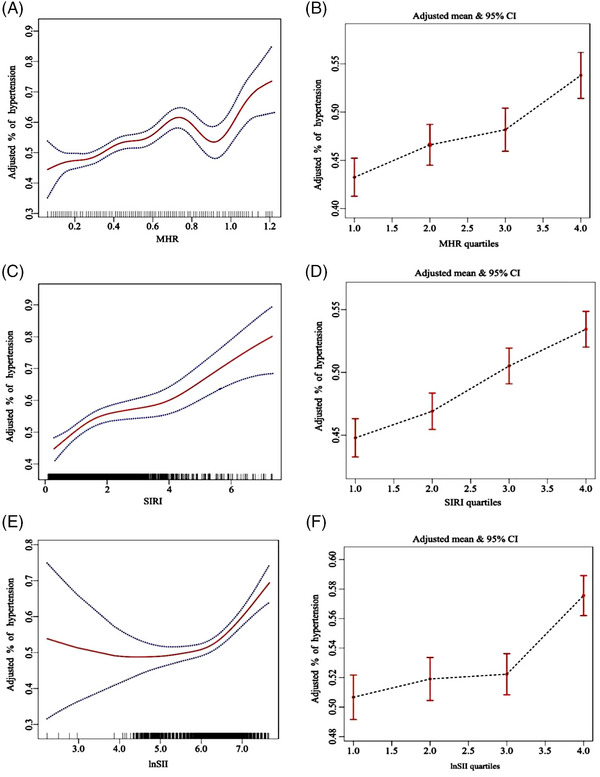
FIGURE 3.

The relationship between hypertension and inflammatory markers (MHR, SIRI, lnSII) by using weighted generalized additive model and smooth curve fitting, after adjusting age, gender, race, poverty income ratio, education level, drinking, smoking, physical activity, BMI, fasting blood glucose, energy, diabetes, coronary heart disease, and anti‐hypertensive drugs.
