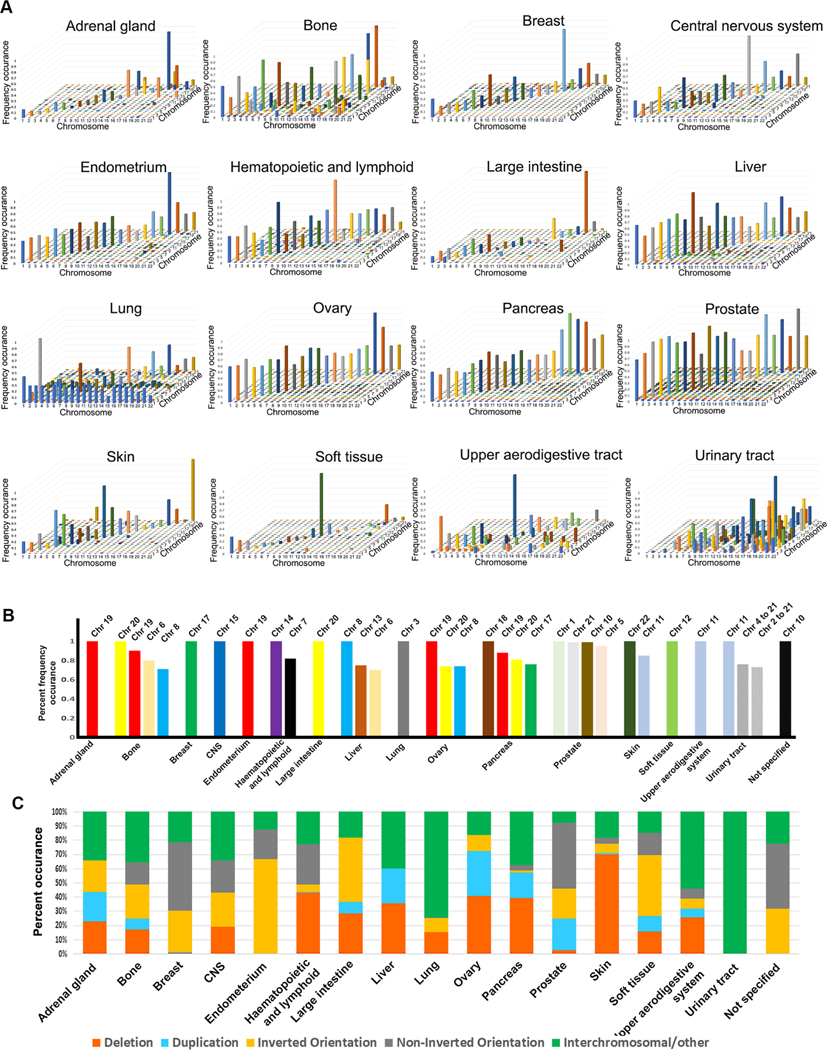
Fig. 4. Aberration endpoint signatures in human cancers.
A. Graphs of concordance matrices to map aberration endpoints density. The X-axis represents one aberration endpoint (1st breakpoint) while the Z-axis represents the other (2nd breakpoint). The Y-axis represents incidence frequency. B. Summary of concordance matrices to map chromosome specific aberration endpoints (breaks) in different cancers (see Supplementary Fig. S5). This graph shows only those chromosomes with a frequency occurrence of 0.7 or above. Complete data is shown in Supplementary Fig. S5. C. Distribution of the several types of chromosomal aberrations by cancer type. “Non-inverted orientation” represents unknown or uncharacterized.

