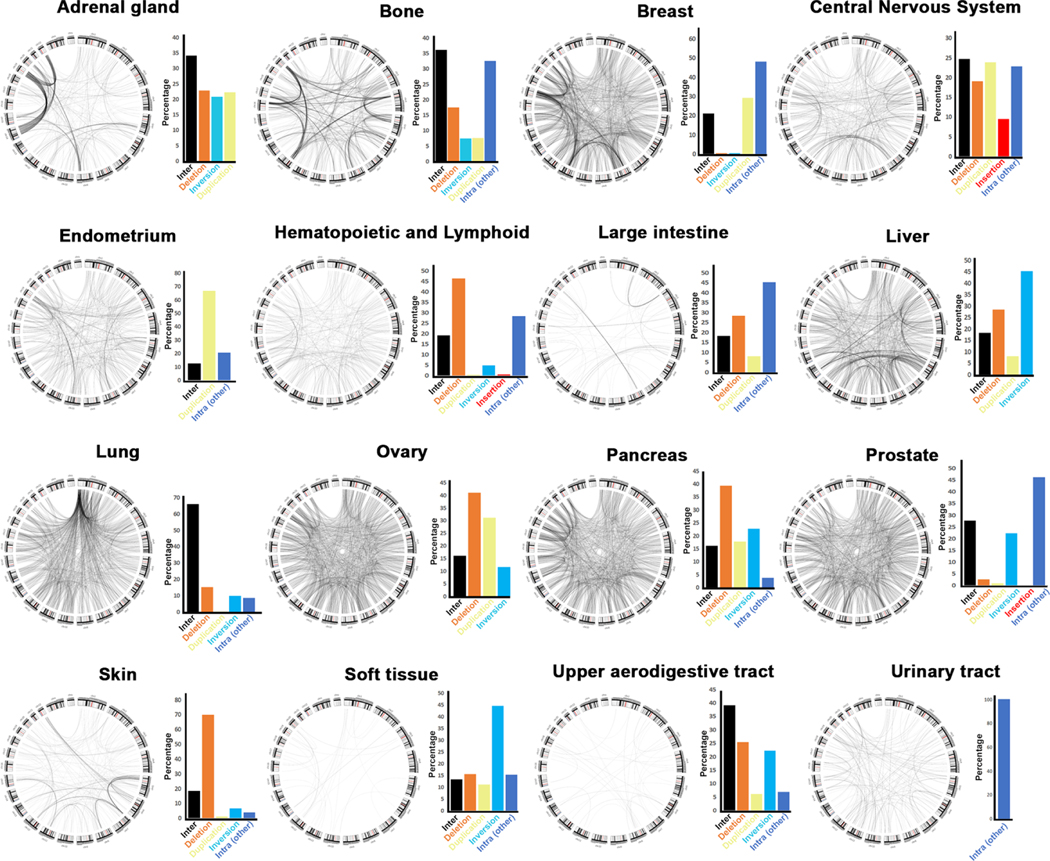
Fig. 5. Signature inter-chromosomal aberrations in human cancers.
Circos plots showing inter-chromosomal translocations by cancer type. Next to each graph, the percent of intra-chromosomal aberrations is shown for comparison. These circus plots represent all re-arrangements reported on COSMIC (e.g., from all publications). Publications where these data were first reported may have graphed subsets of these rearrangements. Some data were not previously published. Please see Table 1 for complete references for all these data.

