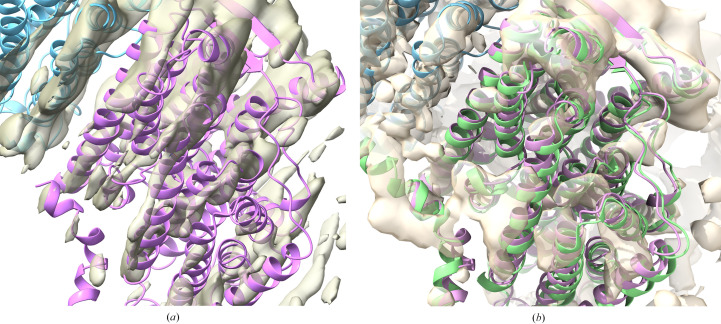
Figure 2.
Model derived from chain L (magenta) of PDB entry 3rko, docked into the region of the map corresponding to chain L of PDB entry 7nyu (EMDB entry EMD-12654). Chain M of PDB entry 7nyu is shown in light blue. (a) The map is computed using the Fourier coefficients  arising from analysis of the local map volume (Millán et al., 2023 ▸). (b) Chain L of PDB entry 7nyu is shown in light green, and the map is the full map from EMDB entry EMD-12654.

