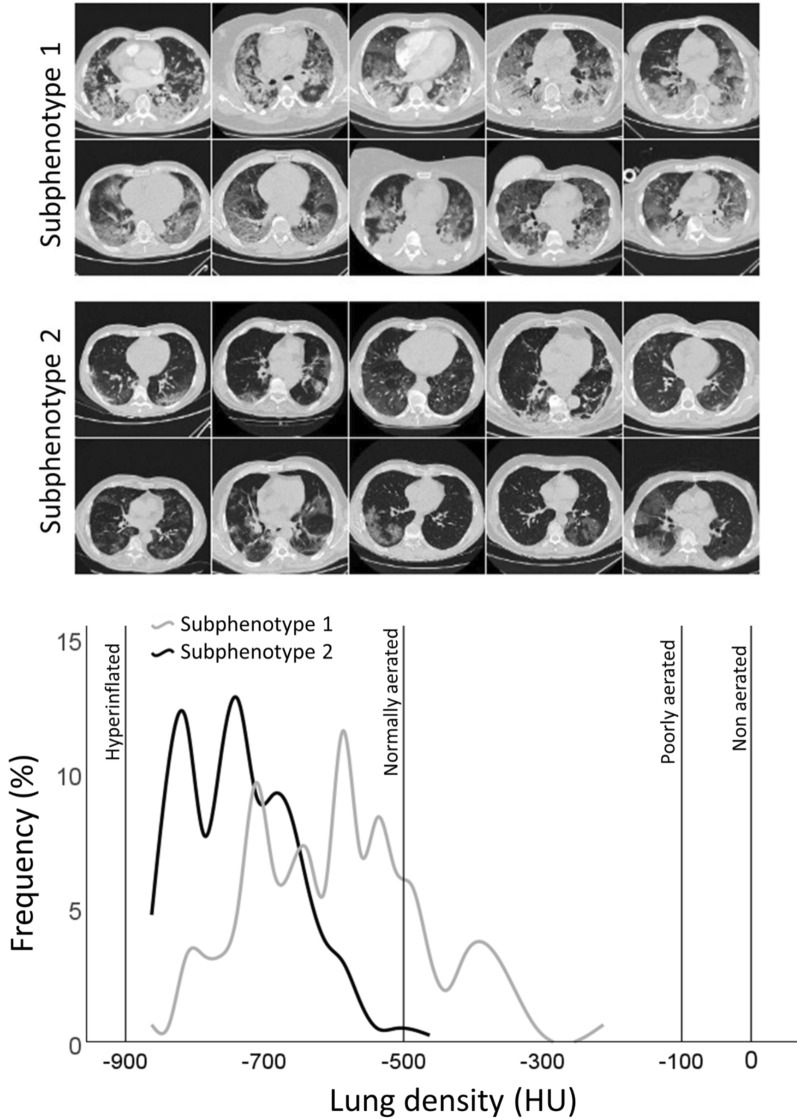
Fig. 2.
Ten representative images of lung CT scan images in the subphenotype 1 (upper panel) and subphenotype 2 (middle panel). In the lower panel, different lung cumulative density distribution measured with CT X-rays attenuation of the whole lung between the two subphenotypes. Interpolation lines are displayed to reduce frequency oscillation. Mean lung density < − 900 HU: Hyperinflated; − 900 HU ≤ Mean lung density < − 500 HU: normally aerated; − 500 HU ≤ Mean lung density < − 100 HU: poorly aerated; Mean lung density ≥ − 100 HU ≤ 0 HU: non aerated. HU hounsfield units

