Fig. 1.
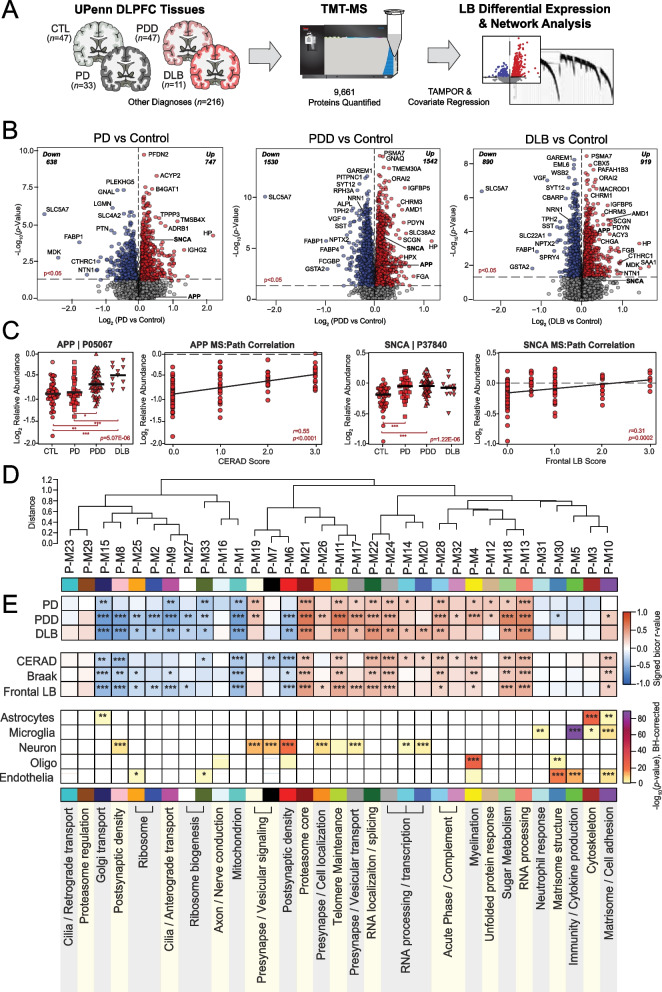
Differential expression and network analysis of UPenn LBD tissues. A Study approach for analyzing differential expression and co-expression across UPenn LB DLPFC tissues, including control (n = 47), PD (n = 33), PDD (n = 47), and DLB (n = 11) cases. B Volcano plots displaying the log2 fold change (x-axis) against the -log10 statistical p value (y-axis) for proteins differentially expressed between pairwise comparisons of each disease to controls. All p values across pairwise comparisons were derived by ANOVA with Tukey post-hoc correction. C Boxplots of MS-measured APP and SNCA levels and their correlations to neuropathology measures of global amyloid plaque (CERAD) and frontal LB deposition, respectively. ANOVA p values are provided for each MS abundance plot (*, p < 0.05; **, p < 0.01; ***, p < 0.001), while the Pearson correlation coefficient with associated p value is provided for each correlation analysis. D Co-expression network generated by WGCNA across control and LB cases, consisting of 33 modules each labeled with a number and color. Module relatedness is shown in the dendrogram. E Neuropathological trait correlations, cell type marker enrichment, and principal gene ontology for each module. Module abundances were correlated to disease diagnosis and measures of pathological burden with positive correlations indicated in red and negative correlations in blue. The cell type nature of each module was assessed by module protein overlap with cell type-specific marker lists of astrocytes, microglia, neurons, oligodendrocytes, and endothelia. Gene ontology analysis was used to identify the primary biology reflected by each module. Asterisks in each heat map indicate the degree of statistical significance of trait correlations and cell type marker enrichment (*, p < 0.05; **, p < 0.01; ***, p < 0.001). Abbreviations: CTL, control; PD, Parkinson’s disease; PDD, Parkinson’s disease dementia; DLB, Dementia with Lewy bodies; DLPFC, dorsolateral prefrontal cortex; TMT-MS, Tandem mass tag mass spectrometry; APP, amyloid precursor protein; SNCA, α-synuclein

