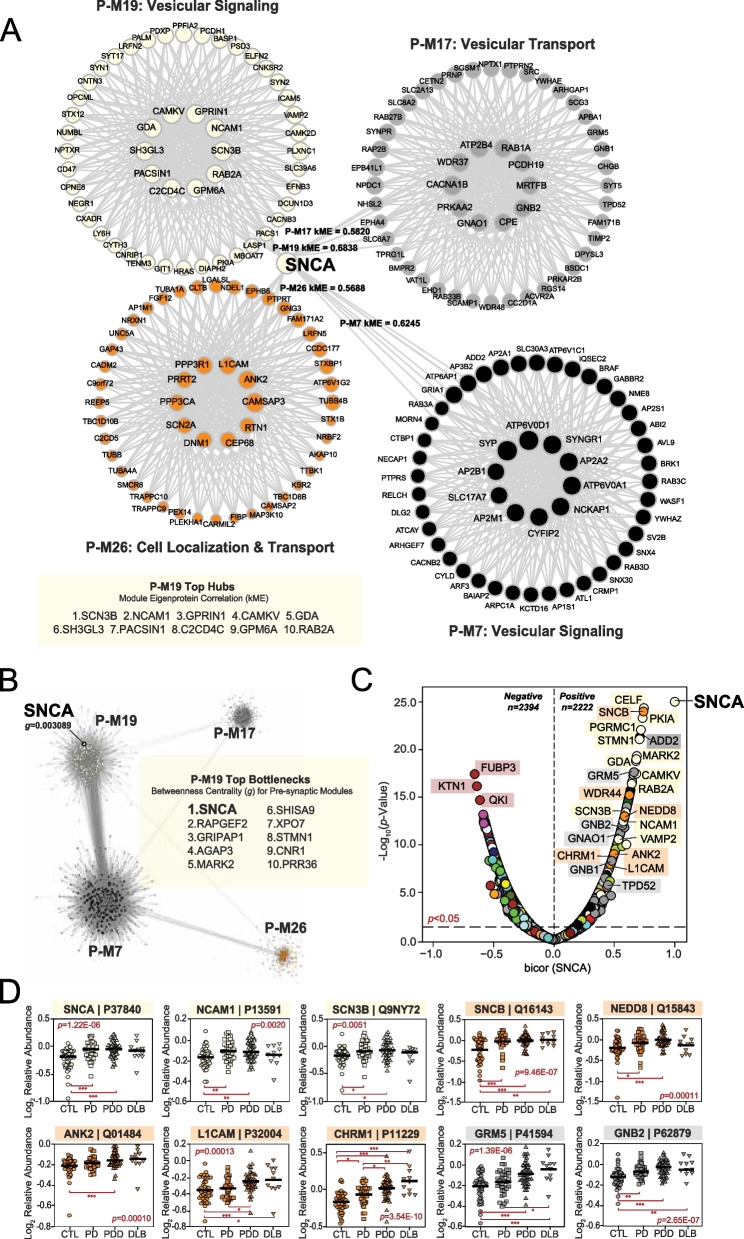
Fig. 3.
Alpha-synuclein serves as a bottleneck protein between presynaptic UPenn modules. A Graphical representation of SNCA module membership (kME) relative to four neuronal modules in the UPenn co-expression network. While assigned to P-M19, SNCA was not a hub of this module. In addition, SNCA maintained moderately strong correlations to P-M7, P-M17, and P-M26 with kME values approaching or exceeding 0.6. All four modules were linked to presynaptic biological ontologies. The top hub proteins for P-M19 are shown. B Graphical representation of the bottleneck analysis performed among the four presynaptic modules of interest. Top bottlenecks for P-M19 across these modules are shown based on measures of betweenness centrality (g). SNCA featured the highest g value of P-M19, indicating its central role in information flow between the four modules. C Volcano plot displaying the biweight midcorrelation (bicor) to SNCA abundance (x-axis) against the -log10 statistical p value (y-axis) for all proteins quantified in the UPenn dataset. Proteins are shaded according to color of module membership. There were 2,394 proteins with statistically significant (p < 0.05) negative correlations and 2222 proteins with significant positive correlations to SNCA abundance. Presynaptic modules were among those most highly represented among proteins with the strongest positive SNCA correlations. SNCA -log10 p value was set from > 200 to 25 to keep plot scale. D Abundance plots for select individual proteins with significant positive correlations to SNCA abundance, highlighting presynaptic modules P-M17, P-M19, and P-M26. ANOVA p values are provided for each abundance plot (*, p < 0.05; **, p < 0.01; ***, p < 0.001). Module eigenprotein box plots represent the median and 25th and 75th percentiles, while data points up to 1.5 times the interquartile range from each box hinge define the extent of error bar whiskers. Abbreviations: SNCA, α-synuclein

