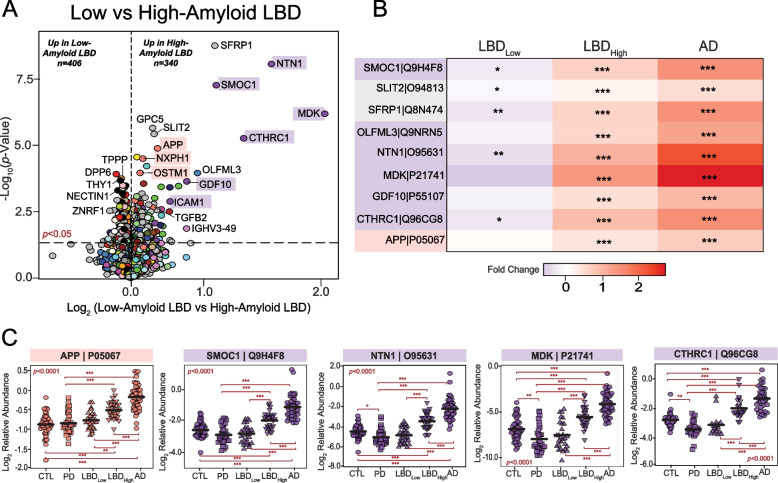
Fig. 6.
Matrisome proteins distinguish UPenn LBD cases with low and high amyloid burden. A Volcano plot displaying the log2 fold change (x-axis) against the -log10 statistical p value (y-axis) for proteins differentially expressed between UPenn LBD cases with low (CERAD 0–1) versus high (CERAD 2–3) amyloid deposition. All p values were derived by t-test analysis. Proteins are shaded according to color of module membership. Proteins mapping to M10 matrisome in the UPenn LBD network were among those most differentially expressed. B Heat maps depicting the fold change magnitude of select matrisome and other proteins across UPenn LBD and AD cases. Increases in protein levels are indicated in red, while decreases are in blue. Asterisks in each heat map indicate the statistical significance of the fold change (*, p < 0.05; **, p < 0.01; ***, p < 0.001). (C) Plots of individual protein abundances across groups, including low- and high-amyloid LBD. ANOVA p values are provided for each abundance plot (*, p < 0.05; **, p < 0.01; ***, p < 0.001). Abbreviations: CTL, control; PD, Parkinson’s disease; LBDLow, Low-amyloid Lewy body dementia; LBDHigh, High-amyloid Lewy body dementia

