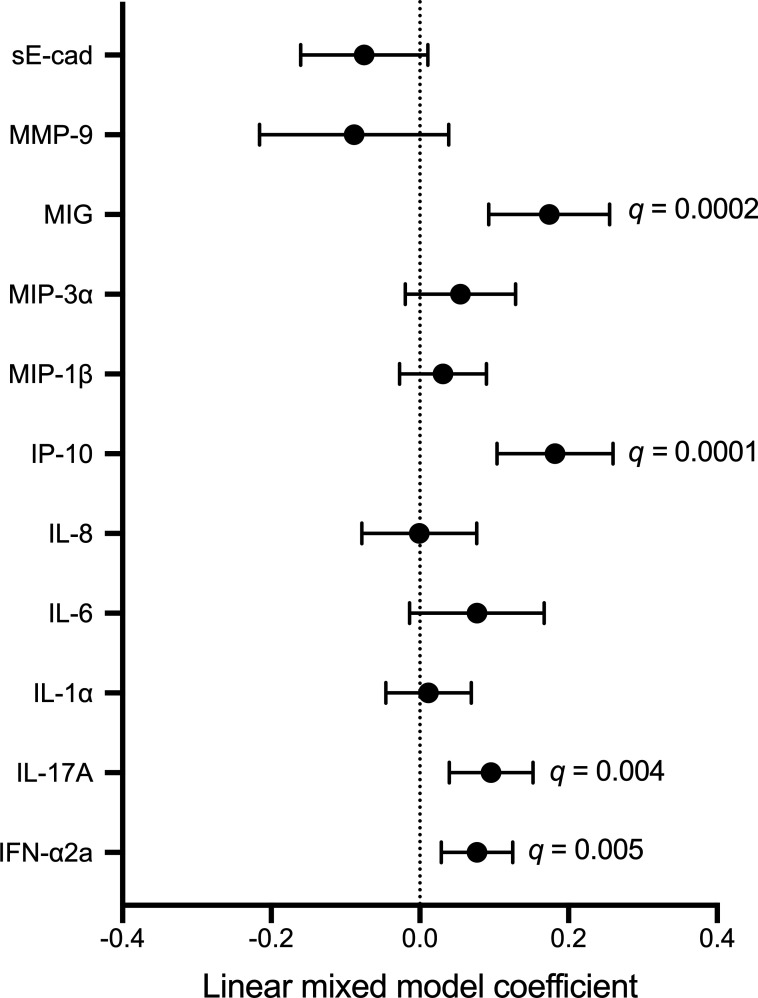
Fig 8.
Immune correlates of fungi during and after study product administration. P-values generated with linear mixed models that included timepoints during and after study product administration. FDR-corrected q values that remained significant were included on the figure as annotations. Each model included fungal abundance as the independent variable and bacterial abundance as the dependent variable.

