
Figure 6-.
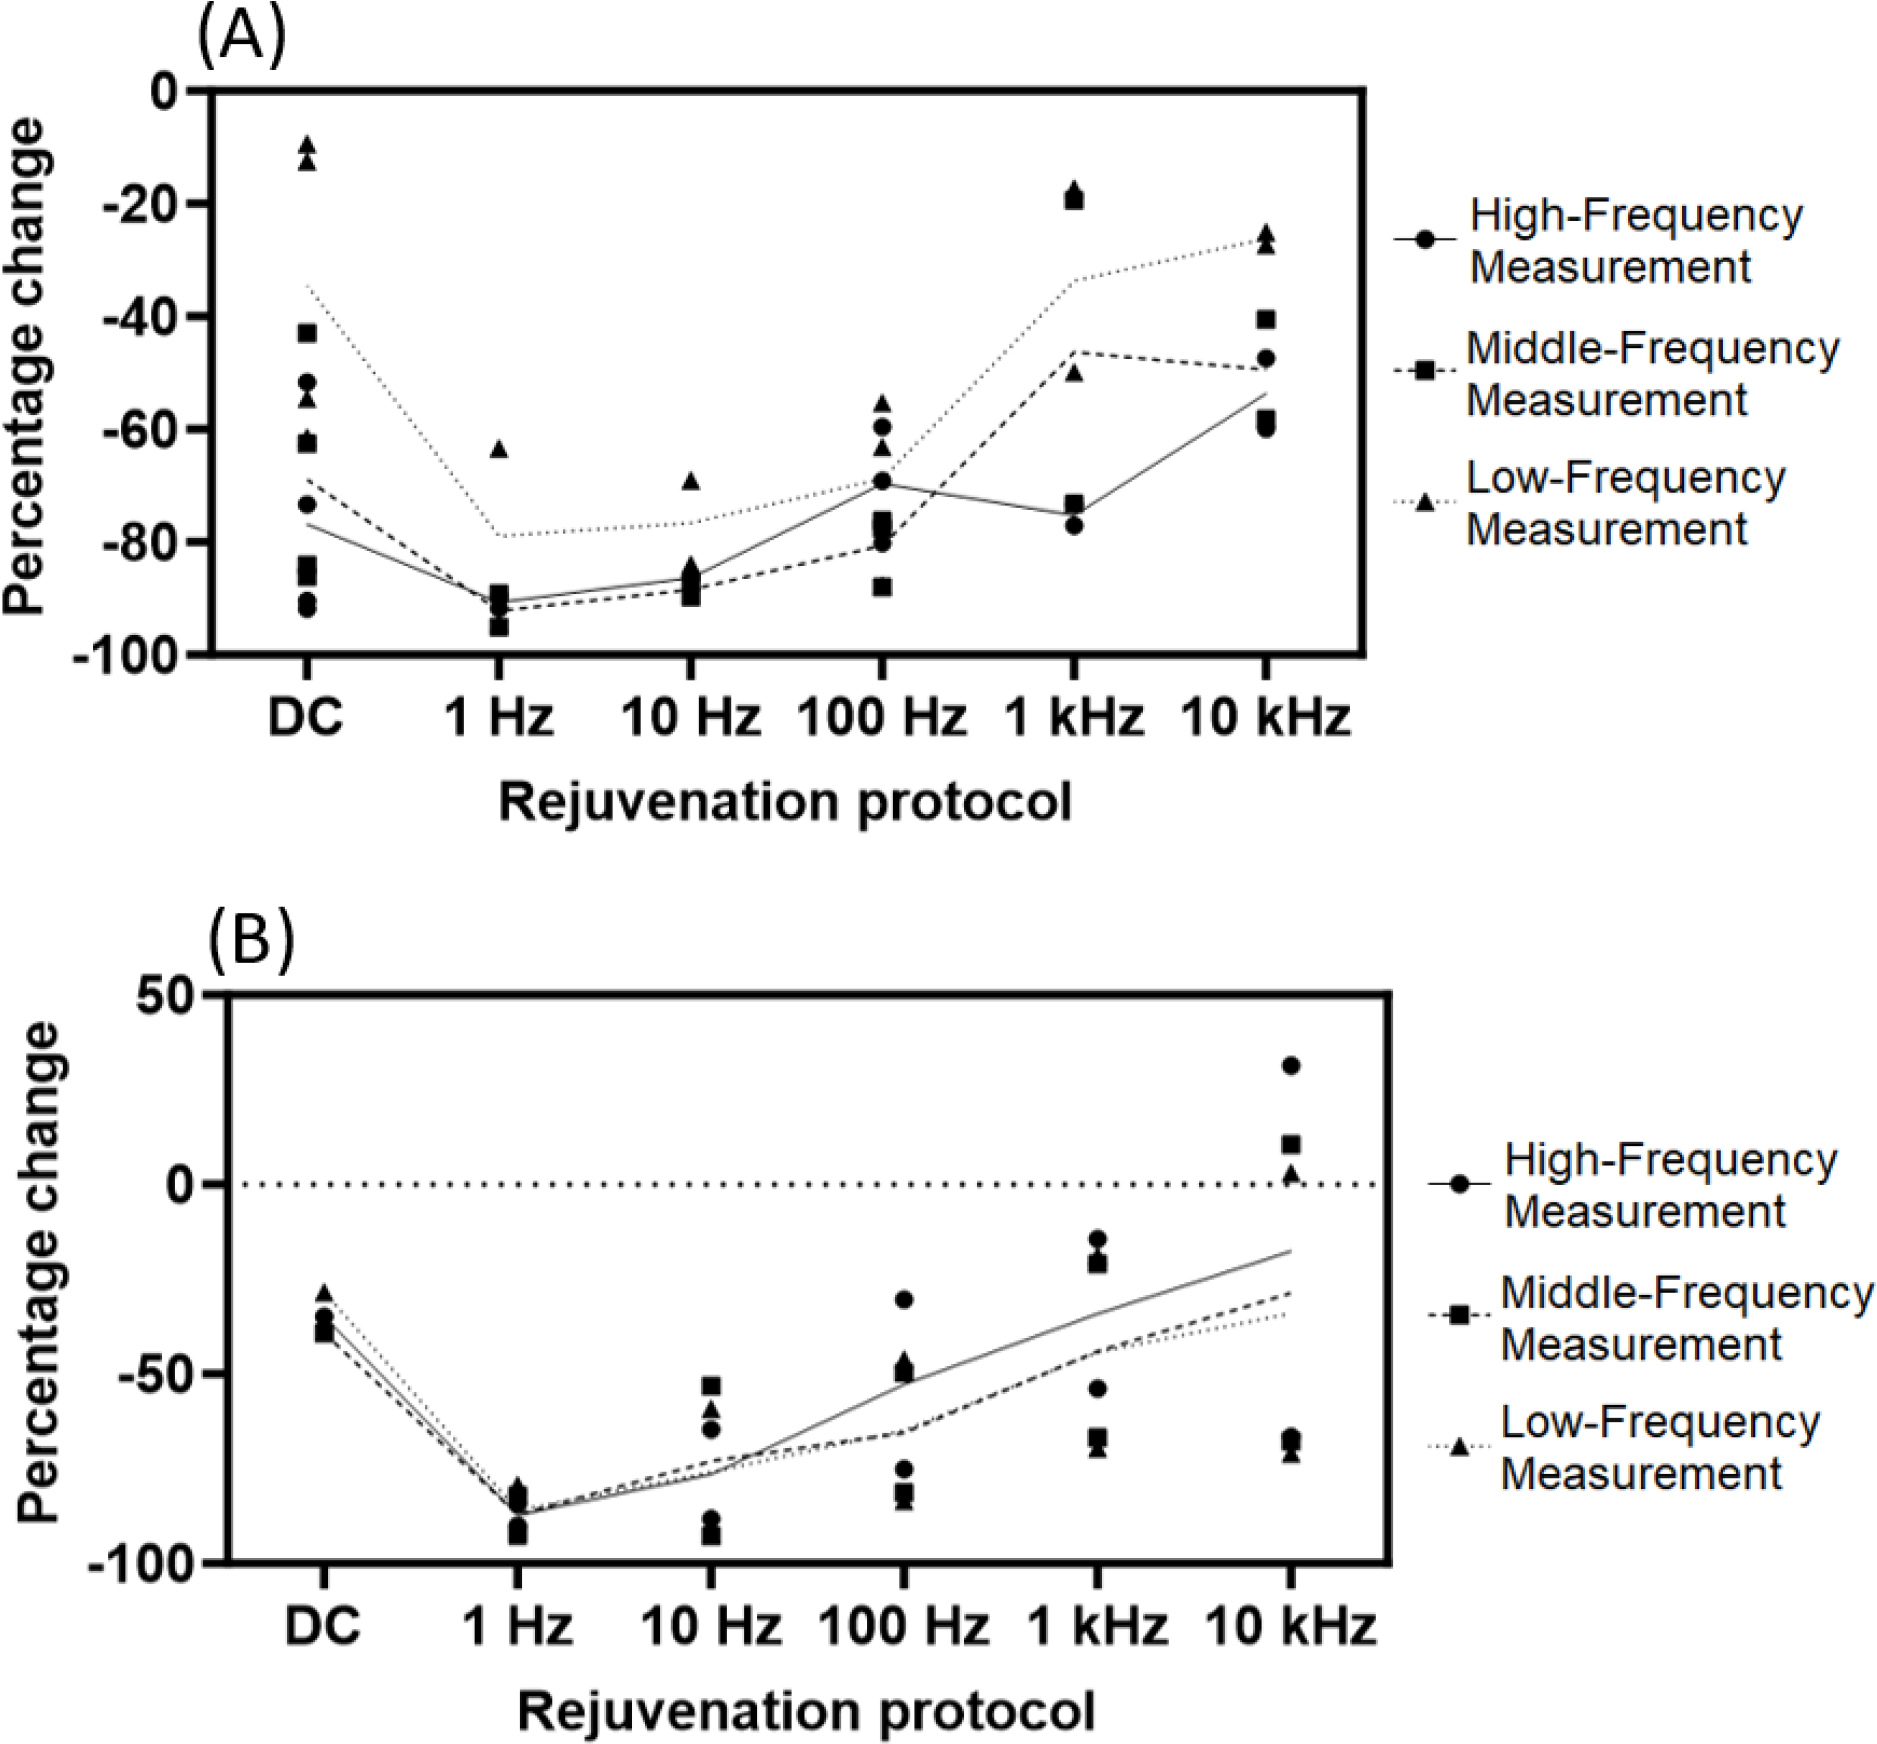
Summary of rejuvenation results for NHP1, showing the percent change in impedance observed with each rejuvenation protocol. Data for all channels rejuvenated with each protocol are shown at 3 measurement frequencies. Note that frequencies depicted for rejuvenation protocols (X axis) are frequencies of stimulation, while frequencies of measurement are frequencies at which the electrode impedance was characterized (High-Frequency = 1 kHz, Middle-Frequency = 112 Hz, and Low-Frequency = 10 Hz). Percent change values reflect the change in impedance observed immediately post-rejuvenation. Trendlines depict mean values within each category. Results for NHP1’s ECoG electrode are shown in (A). Note that low-frequency AC rejuvenation resulted in the largest percent change in measured impedance. (B) depicts NHP1’s DBS electrode results. Low-frequency AC rejuvenation was most effective in this electrode as well, with the highest rejuvenation frequency (10 kHz) failing to reduce measured impedance for some datapoints.