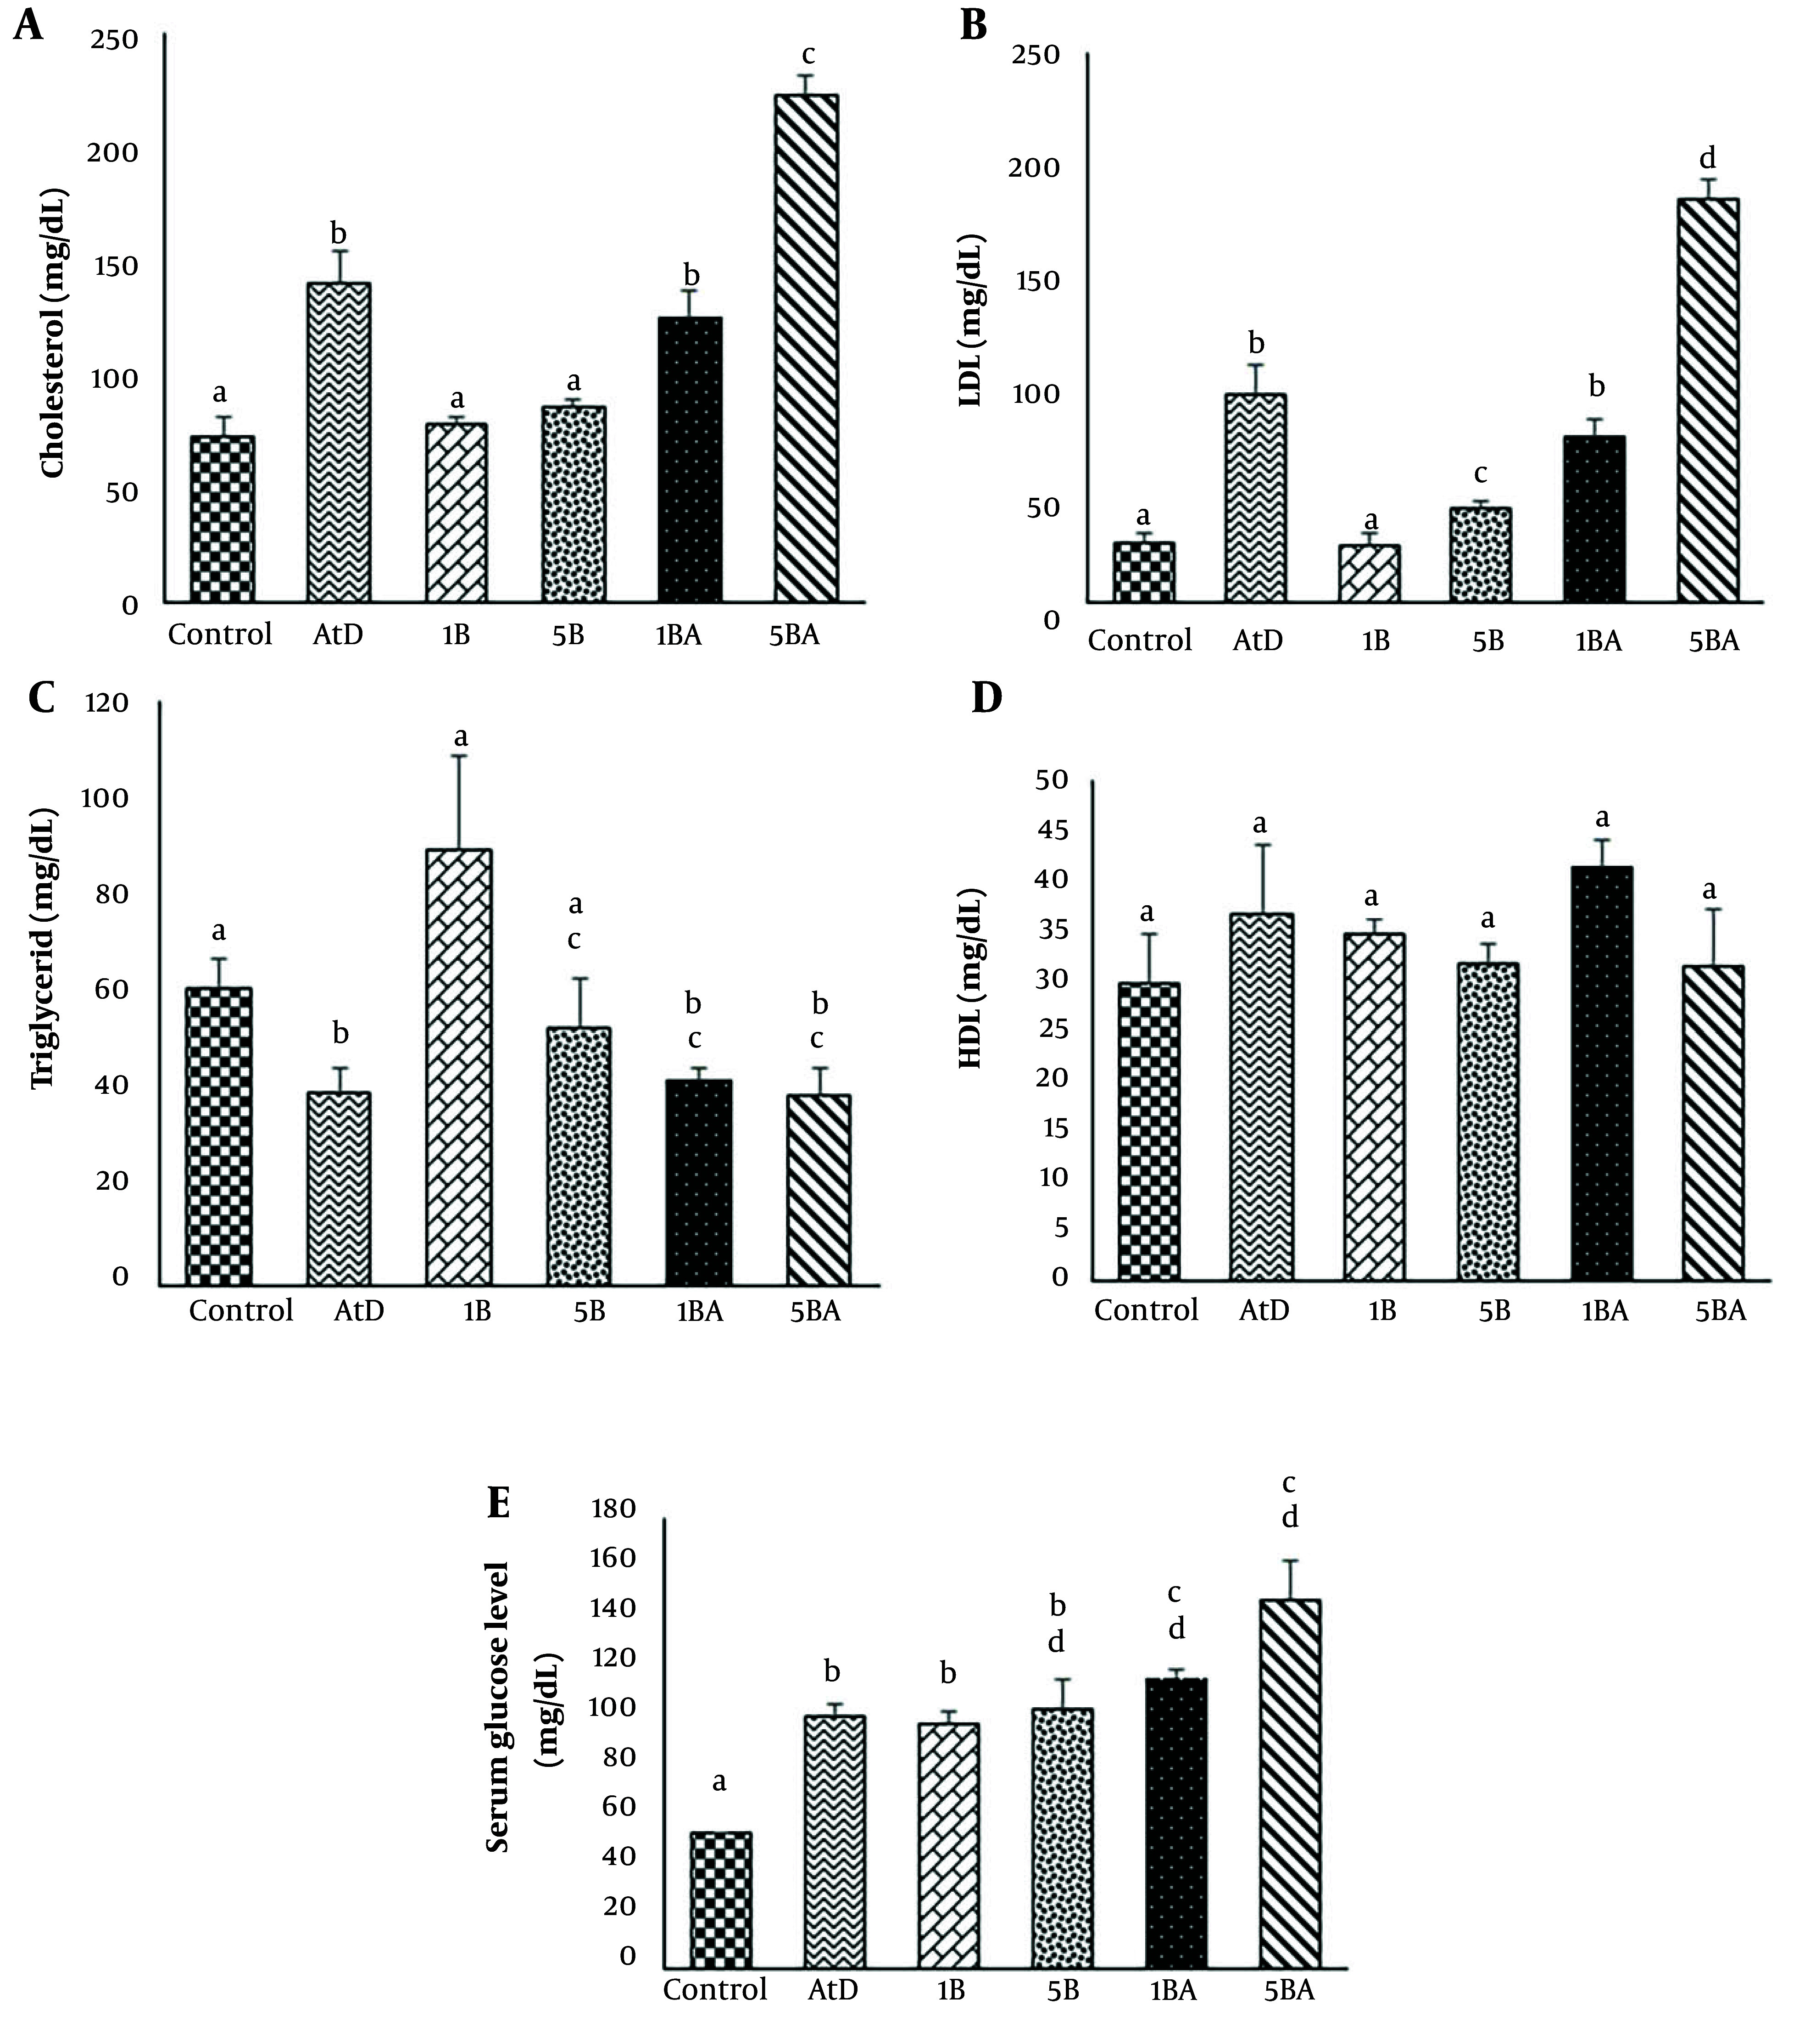
Figure 3. Serum lipid profiles and glucose levels in all experimental groups. Serum lipid values are given as mg/dL and were shown as the average of 3 mice. Different superscript letters (a, b, c, etc.) indicate statistically significant differences at a P-value < 0.05 between the groups. Error bars indicate standard error (S.E) [Abbreviation: LDL, low-density lipoprotein; HDL, high-density lipoprotein; AtD, levels, atherogenic diet; 1B, (1 mg/kg BaP); 1BA, (AtD + 1 mg/kg BaP); 5B, (5 mg/kg BaP); 5BA, (AtD + 5 mg/kg BaP)].

