Figure 4.
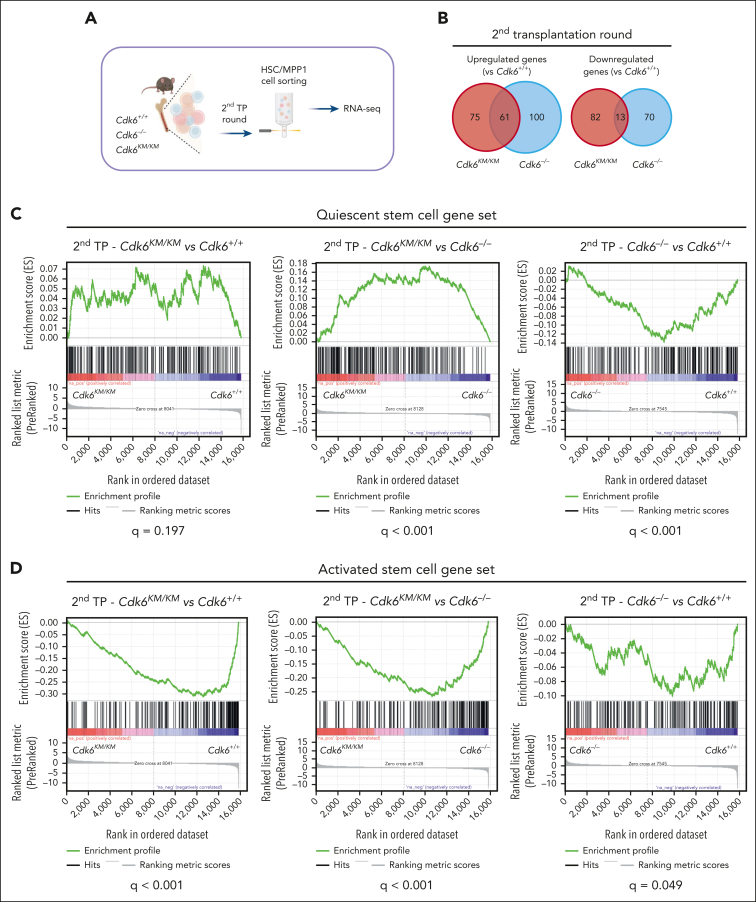
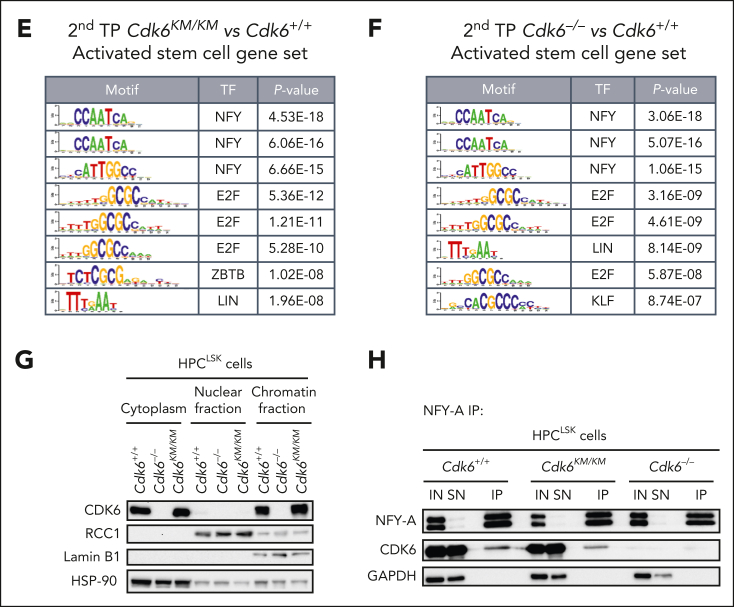
Kinase-inactivated CDK6 balances quiescent and activated transcriptional programs of HSCs. (A) Experimental workflow of low-input RNA-seq of engrafted CD45.2+ HSC/MPP1 cells after 2 serial rounds of transplantation. (B) Venn diagrams showing genes uniquely or commonly upregulated (left) and downregulated (right) in Cdk6–/– and Cdk6KM/KM compared with Cdk6+/+ HSC/MPP1 cells after 2 serial rounds of transplantation (n=3; |Log2FC| ≥ 0.3; adjusted P value < .2). (C-D) Gene set enrichment analysis to test for the enrichment of quiescent or activated stem cell gene sets in differentially expressed genes coming from 3 analyses: HSC/MPP1 cells of Cdk6KM/KM compared with Cdk6+/+ cells, Cdk6KM/KM compared with Cdk6–/–, or Cdk6–/– compared with Cdk6+/+ after 2 serial rounds of transplantation. (E-F) Transcription factor motif enrichment analysis of genes within the activated stem cell gene set that are either upregulated in (E) Cdk6KM/KM compared with Cdk6+/+ HSC/MPP1 cells or (F) Cdk6–/– compared with Cdk6+/+ HSC/MPP1 cells upon 2 serial rounds of transplantation. (G) Subcellular fractionation of Cdk6+/+, Cdk6–/–, and Cdk6KM/KM HPCLSK cells, followed by western blot analysis of CDK6. Lamin B1/regulator of chromosome condensation 1 (RCC1) served as a nuclear marker, whereas heat shock protein 90 (HSP-90) served as a cytoplasmic marker. (H) Anti-NFY-A co-immunoprecipitation (co-IP) from Cdk6+/+, Cdk6–/–, and Cdk6KM/KM HPCLSK cell extracts followed by NFY-A and CDK6 immunoblotting. IN indicates the input lysate and SN indicates the supernatant after IP. Glyceraldehyde-3-phosphate dehydrogenase (GAPDH) served as loading control.


