Figure 5.
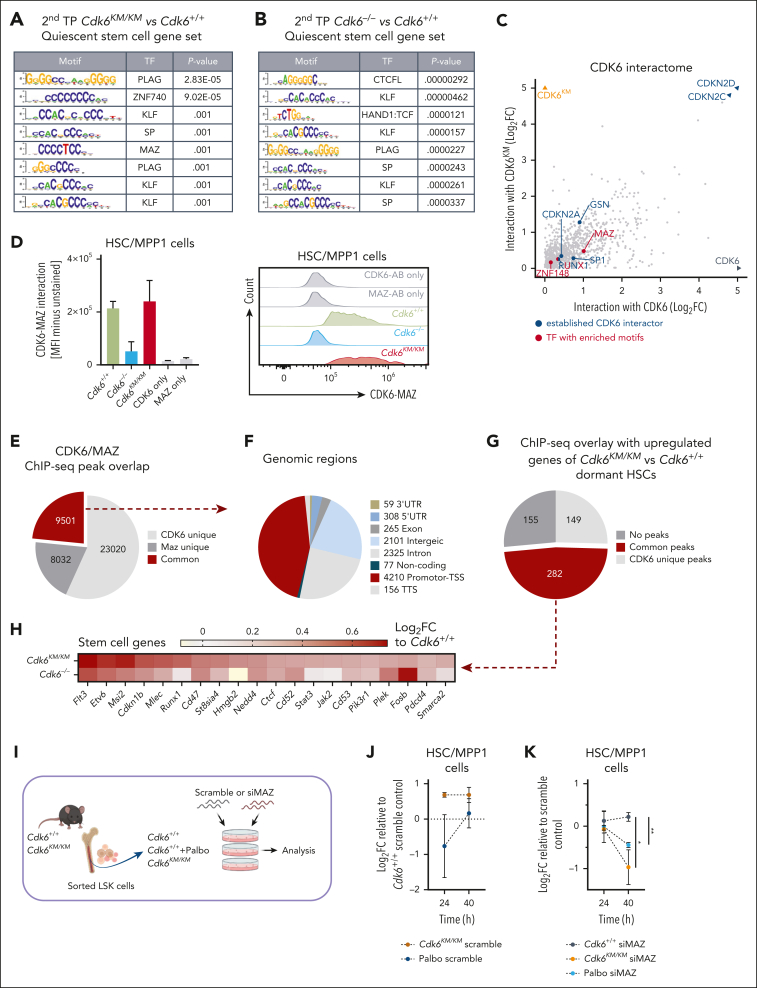
Kinase-inactivated CDK6 and MAZ influence HSC maintenance. (A-B) Transcription factor motif enrichment analysis of genes within the quiescent stem cell gene set that are either upregulated in (A) Cdk6KM/KM compared with Cdk6+/+ cells or (B) Cdk6–/– compared with Cdk6+/+ cells after 2 serial rounds of transplantation. (C) CDK6 interactome analysis generated by nuclear CDK6-IP mass spectrometry analysis of HPC-7 cell lines expressing either wild-type CDK6 or CDK6KM. Dot plot illustrating all protein interactions with CDK6 or CDK6KM vs CDK6–/– (Log2FC). Established CDK6 interactors are highlighted in blue. Transcription factors interacting with CDK6KM and analyzed from the CDK6KM specific motif analysis from supplemental Figure 5A are highlighted in red. (D) Flow cytometry proximity ligation assay of CDK6 and MAZ antibodies showing endogenous protein interaction in ex vivo Cdk6+/+, Cdk6–/–, and Cdk6KM/KM HSC/MPP1 cells. Representative flow cytometry histograms are depicted on the right. Cdk6–/– cells, MAZ, and CDK6 antibody only samples served as controls. (E) Overlap of CDK6 ChIP-seq data from BCR/ABLp185+ cells with published MAZ ChIP-seq data from CH12.LX mouse lymphoma cell line. (F) Annotation of the genomic regions identified in the CDK6/MAZ ChIP-seq overlap. (G) CDK6/MAZ ChIP-seq overlay (+2 kb to –500 bp to transcription start site [TSS]) with upregulated genes of Cdk6KM/KM compared with Cdk6+/+ dormant HSC subcluster genes (scRNA-seq FC ≥ 0.3). (H) Stem cell genes of Cdk6KM/KM or Cdk6–/– cells compared with Cdk6+/+ cells with a CDK6-MAZ ChIP peak. (I) Experimental design of siRNA MAZ knockdown assay in sorted Cdk6+/+LSK cells ± palbociclib treatment and in Cdk6KM/KM LSK cells. (J-K) Flow cytometry analysis of (J) HSC/MPP1 scramble cells and (K) HSC/MPP1 cell subset of LSK cells upon MAZ knockdown ± palbociclib treatment depicted as Log2FC relative to corresponding scramble controls (n = 4 per genotype, mean ± SEM). ∗P < .05; ∗∗P< .01.

