Figure 6.
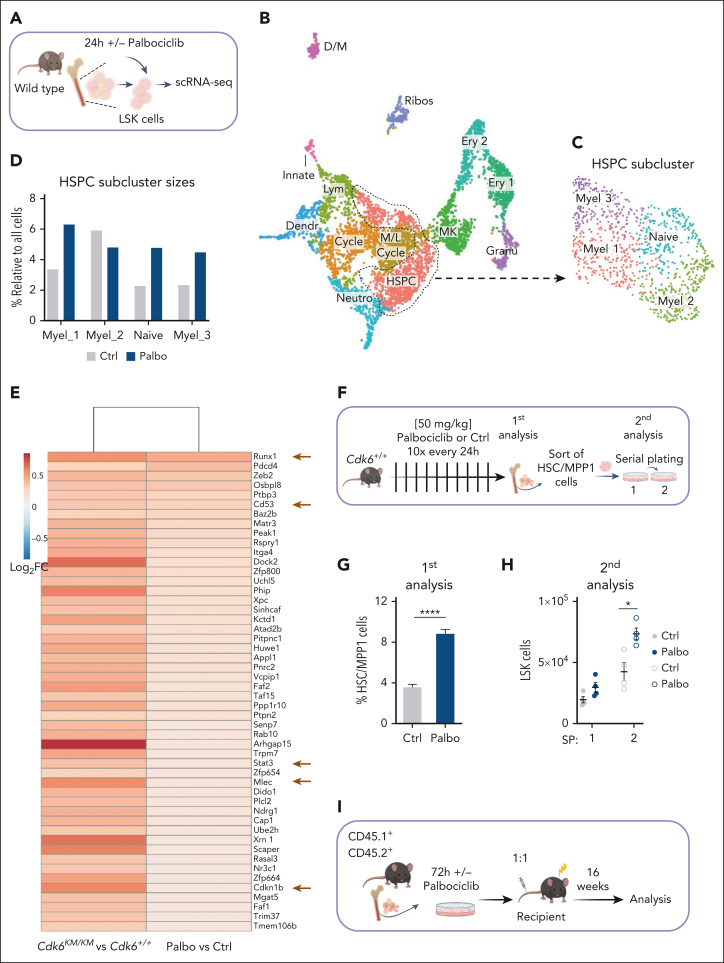
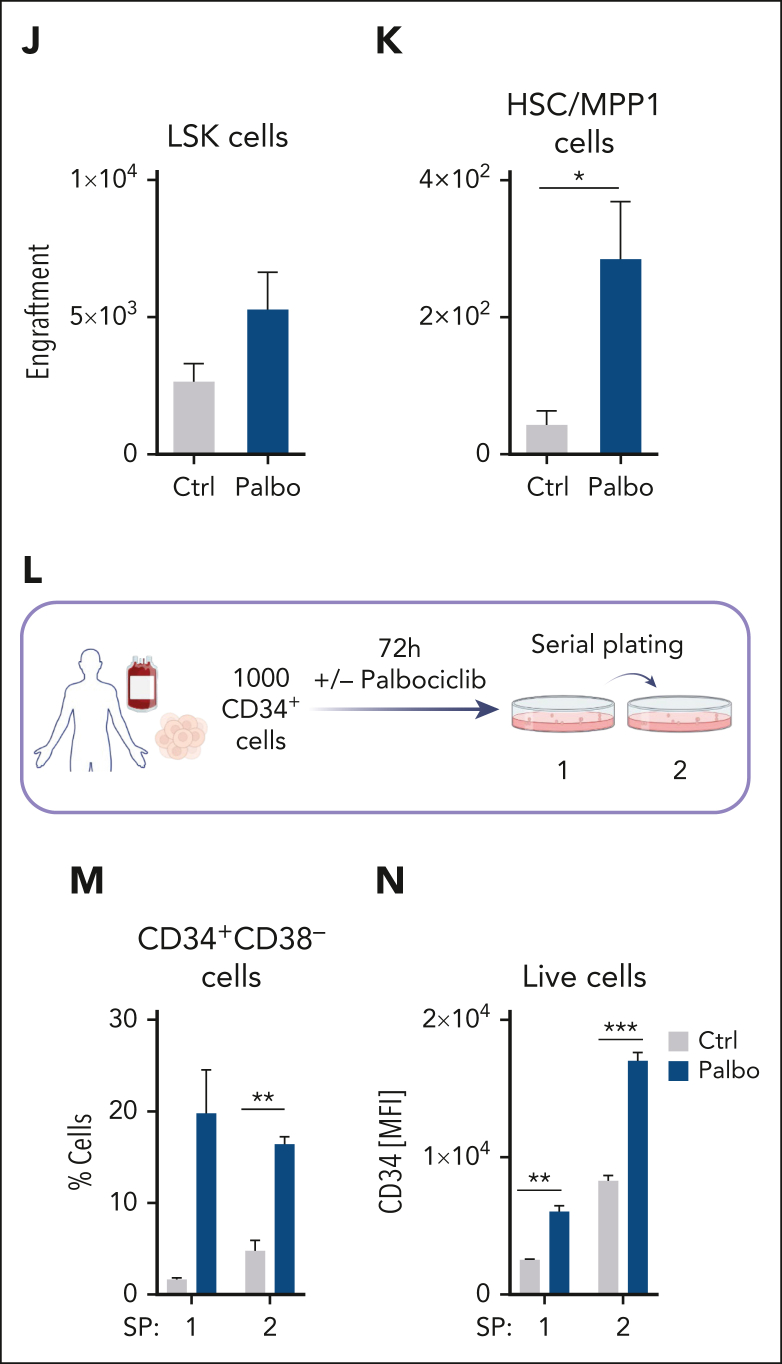
CDK4/6 kinase inhibition protects HSC fitness. (A) Experimental scheme of 10x Genomics scRNA-seq including flow cytometry sorting of LSK cells followed by 24-hour cultivation with either PBS or palbociclib. (B) UMAP visualization of 13 LSK cell clusters. Colors indicate different clusters. (C) UMAP of 4 HSPC subclusters. Myel 1: granulocyte; Myel 2: dendritic; Myel 3: neutrophil; and Naïve: immature cells. (D) Bar chart of relative HSPC subcluster sizes of the PBS or palbociclib-treated samples. (E) Heat map of top 50 upregulated genes upon palbociclib treatment compared with controls out of the 282 genes found in Figure 5G. Errors indicate top genes of Figure 5H, also found in the palbociclib comparison. (F) Experimental design to assess in vivo palbociclib treatment followed by an in vitro serial plating assay of sorted HSC/MPP1 cells. (G) Flow cytometry analysis of HSC/MPP1 cells and (H) serially plated LSK cell numbers upon in vivo palbociclib treatment (n ≥ 4, mean ± SEM). (I) Experimental design for competitive BM transplantation assay. CD45.1+ control and palbociclib-treated (200 nM) CD45.2+ BM cells were transplanted in a 1:1 ratio into lethally irradiated recipient mice upon 72 hours of cultivation. (J-K) End point analysis of engrafted BM LSK and HSC/MPP1 cells upon palbociclib treatment (n = 7 per group, mean ± SEM). (L) Experimental overview of PBS or palbociclib-treated human CD34+ cells followed by a serial plating assay. (M-N) Percentage of CD34+CD38– cells and mean fluorescence intensity (MFI) of CD34+ cells in 2 serial plating rounds (n = 3-4 per treatment, mean ± SEM). Cycle, cell cycle; Dendr, dendritic; D/M, dendritic/macrophage; Ery, erythroid; Granu, granulocyte; Innate, innate lymphocyte; MK, megakaryocyte; M/L cycle, myeloid/lymphoid cell cycle; Neutro, neutrophil; Ribos, ribosomes; Ctrl, control. ∗P < .05; ∗∗P < .01: ∗∗∗P< .001; ∗∗∗∗P < .0001.


