
Figure 3.
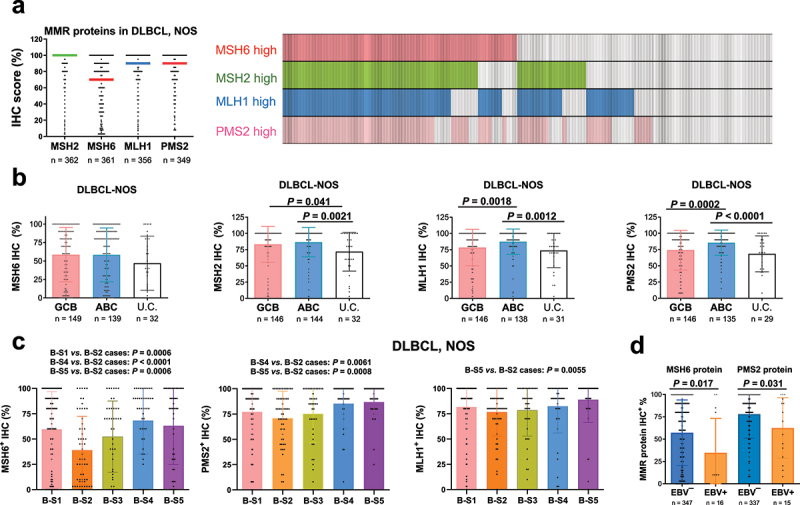
Immunohistochemistry (IHC) analysis for the four MMR proteins in the DLBCL-NOS cohort.
(a) Left: a scatter plot showing the distribution (each dot represents one patient) and median (indicated by horizontal lines) IHC scores (percentage of tumor cells) of the four MMR proteins in DLBCL-NOS cases. MSH6 had a significantly lower median expression score than other three MMR proteins. Right: a case distribution plot (each column represents one patient) showing the overlaps between MSH2high and MSH6high cases and between MLH1high and PMS2high cases in DLBCL-NOS cases scored for all the four MMR proteins. Cutoff for high expression of each MMR protein: the median IHC score. (b) Scatter plots for MMR protein IHC scores in the DLBCL cell-of-origin subtypes (subtyped by GEP). Each dot represents one patient with DLBCL-NOS and bars indicate mean values. The ABC subtype had significantly higher mean levels of MLH1 and PMS2 protein expression than the GCB subtype and unclassifiable (U.C) DLBCL-NOS. Unclassified cases had significantly lower mean MSH2 expression than both ABC and GCB subtypes. P values are by unpaired t test (two tailed). (c) MSH6, PMS2, and MLH1 expression in DLBCL-NOS cases showed differences between ecotyper-assigned subtypes based on the most abundant B cell state in each DLBCL sample. (c) EBV+ DLBCL had lower mean MSH6 and PMS2 IHC scores than EBV-negative DLBCL by unpaired t test.