
Figure 5.
Gene-expression profiling analysis for high vs. low expression of MMR proteins in DLBCL-NOS.
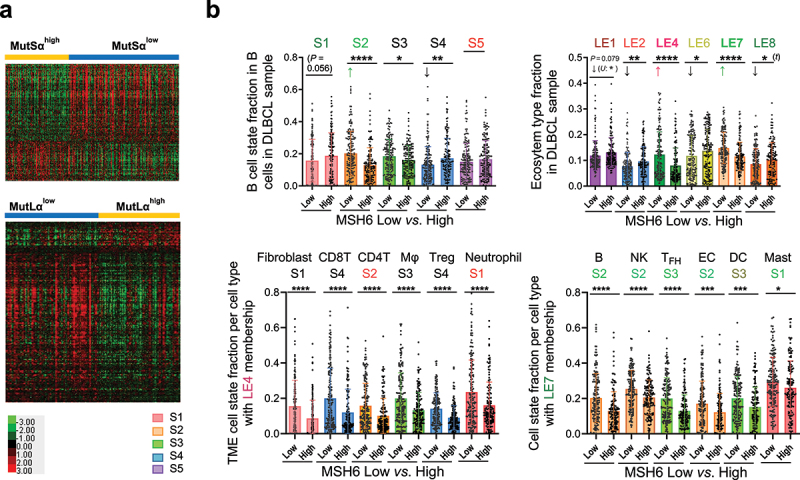
(a) Top: Heatmap visualization for significantly downregulated genes (false discovery rate (FDR) < 0.01 and fold change ≥ 1.5) and upregulated genes in MutSαhigh DLBCLs (FDR <0.05 and fold change ≥ 1.4). Bottom: Heatmap to visualize significantly downregulated genes (FDR <0.01) and upregulated genes (FDR ≤0.02) in MutLαhigh DLBCLs. (b) Cell state and ecosystem subtype analysis by the Ecotyper software and comparisons for DLBCLs with low vs. high expression of MSH6 (cutoff for MSH6high: >70%). Top: Scatter plots for fractions of B-cell states and ecotypes in MSH6high and MSH6low DLBCLs. Bottom: Scatter plots for abundance of cell states comprising the LE4 and LE7 ecotypes. Colors of labels for cell states and ecotypes indicate their associated prognostic effects by Reference 37. Abbreviation: S, state; LE, lymphoma ecosystem type, MΦ, macrophage; Treg, regulatory T cell; NK, natural killer cell; TFH, follicular helper T cell; EC, endothelial cell; DC, dendritic cell. Reddish colors indicate unfavorable prognostic effects, greenish colors indicate favorable prognostic effects, and black color indicates no significant prognostic effect. Significance: *P < 0.05; **P < 0.01; ***P < 0.001; ****P < 0.0001.