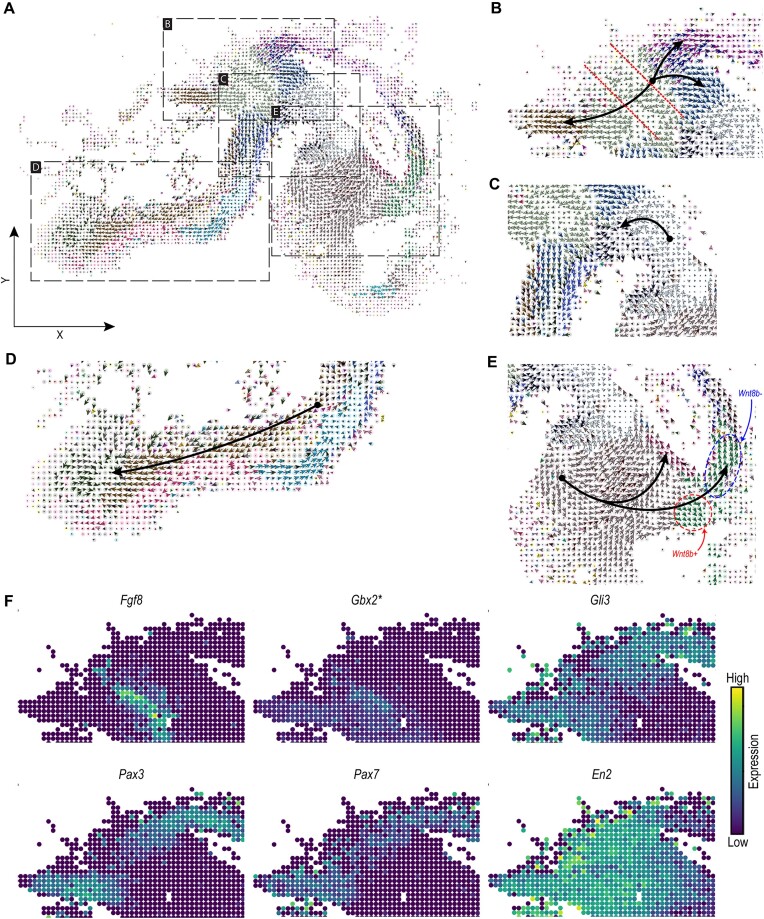
Figure 3.
(A) Cell-level RNA velocities projected on the spatial coordinates of the HybISS spatial data, colored according to the ‘Subclass’ annotation transferred from the scRNA-seq data (same legend as Figure 2C, D). (B–E) Zoom-in views on the same spatial differentiation trajectories as in Figure 3; (B) midbrain-hindbrain boundary, dashed-lines highlight the isthmus region, (C) part of midbrain, (D) hindbrain and (E) forebrain, highlighting two cortical hem populations (Wnt8b+ in red, and Wnt8b– in blue). Black arrows show branching or linear spatial differentiation directions between subclasses (these arrows are drawn manually to highlight certain differentiation trajectories). (F) Overlaid expression of marker transcription factors following the differentiation trajectory in the hindbrain and midbrain. *Predicted expression from scRNA-seq data using SpaGE (20).

