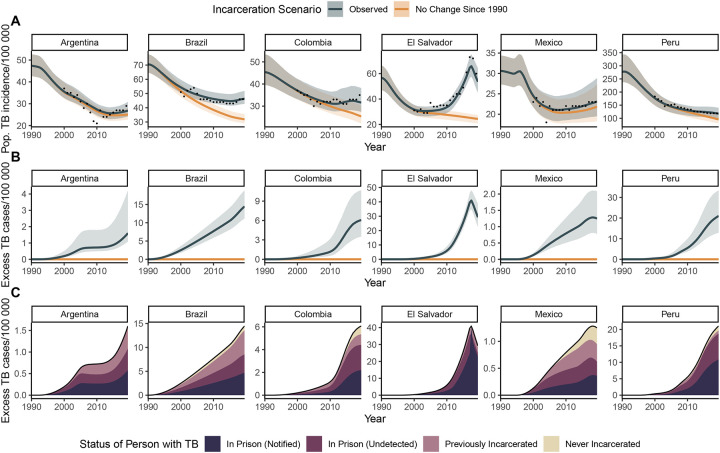
Figure 2. Excess population tuberculosis incidence attributable to the rise in incarceration prevalence since 1990.
A) Population tuberculosis incidence per 100,000 person-years under the observed and counterfactual (no rise in incarceration since 1990) scenarios. Black points represent population tuberculosis (TB) incidence estimates from the World Health Organization, which are available beginning in 2000. Solid lines and shaded bands represent the median and 95% UI respectively. B) Excess population-wide incident tuberculosis cases per 100,000 person-years. C) Median estimates of excess cases, stratified by population subgroup in which they occurred, and for incident cases occurring in prison, additionally stratified by whether the disease was notified or undetected during incarceration. All model results are for the population age 15 and older.

