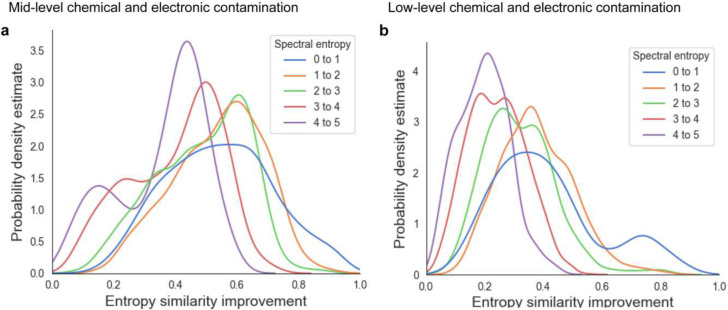
Figure 4.
Density distributions for MS/MS similarity improvements after Spectral Denoising for all MS/MS spectra from 240 injected standards between 0.02–200 pmol, using the 500 pmol spectra as reference. Chemical standards were grouped into five sets with different starting spectral entropies (blue to purple). (a) MS/MS similarity improvements for spectra to which contamination ions were artificially added at ‘mid-levels’, Level 10:1 electronic noise, and Level 1:5 chemical noise. b MS/MS similarity improvements for spectra to which contamination ions were artificially added at ‘low levels’, Level 2:1 electronic noise and Level 1:10 chemical noise.

