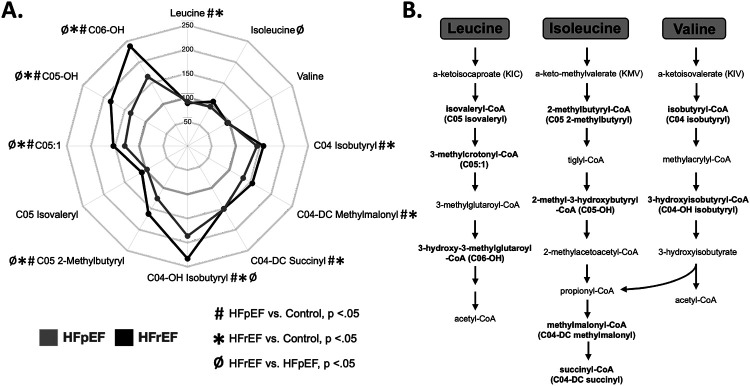
Figure 2. Plasma metabolome in both HFrEF and HFpEF subjects reflect increased BCAA degradation.
A) Radar plot depicting plasma levels of branched-chain amino acids (BCAA) and BCAA metabolites in HFpEF (grey) and HFrEF (black) as percentages of control. Symbols indicate significance of comparisons across groups. B) Diagram displaying the BCAA metabolic pathway. Metabolites in bold represent acylcarnitine species measured in this study. SCAC correlates are indicated in parenthesis.

