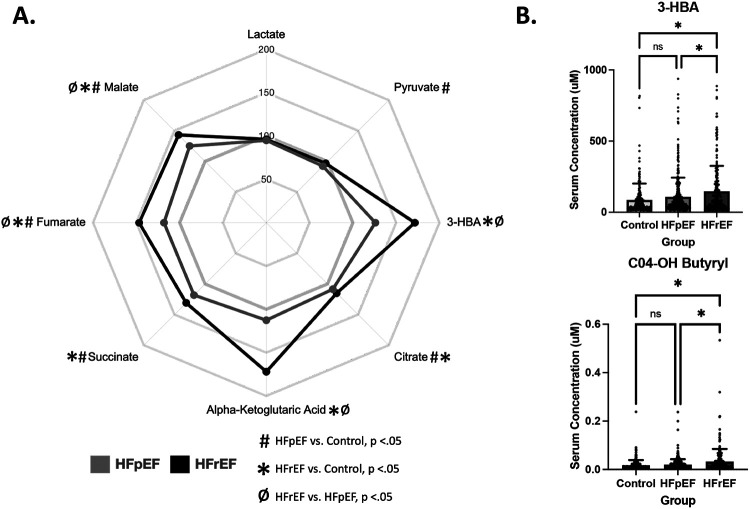
Figure 5. Plasma levels of ketone body 3-hydroxybutyrate (3-HBA), and its downstream metabolite, C4-OH carnitine, are uniquely elevated in HFrEF subjects.
A) Radar plot depicting plasma levels of organic acids in HFpEF (grey) and HFrEF (black) as percentages of control. Symbols indicate significance of comparisons across groups. B) Bar graphs depicting mean +/− SD of serum concentrations 3-HBA (top) and its metabolite C4-OH carnitine (bottom), which are both uniquely elevated in HFrEF. Asterisks indicate p-value <.05.

