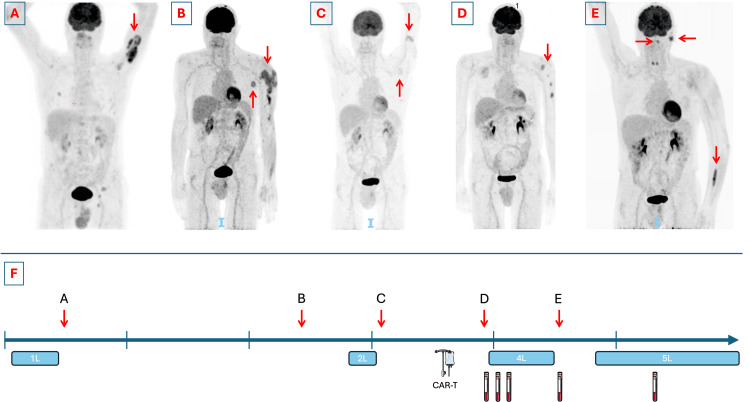
Figure 1. PET-CTs at diagnosis and relapses and treatment timeline.
Panel A: PET-CT at diagnosis (for clarity, only the most important lesions were marked). Panel B: PET-CT demonstrating first progression after first-line therapy. Panel C: PET-CT demonstrating progressive disease after second-line therapy. Panel D: PET-CT demonstrating progressive disease after CAR-T cell therapy. Panel E: PET-CT demonstrating progressive disease after fourth-line therapy. Panel F: Timeline demonstrating the disease course since diagnosis.
Every vertical tick marks a year. Every red arrow is the time point of relapse, referring to the corresponding PET-CT with a letter. Treatment periods are marked with a blue box, labeled with the line (e.g., 1L is first-line treatment). Time points of CAR-T cell quantification are marked with a sample tube.
PET-CT: positron emission tomography-computed tomography, CAR-T cell: chimeric antigen receptor T-cell
This figure was drawn in part using images from Servier Medical Art. Servier Medical Art by Servier is licensed under a Creative Commons Attribution 4.0 Unported License (https://creativecommons.org/licenses/by/4.0/).

