
FIGURE 7.
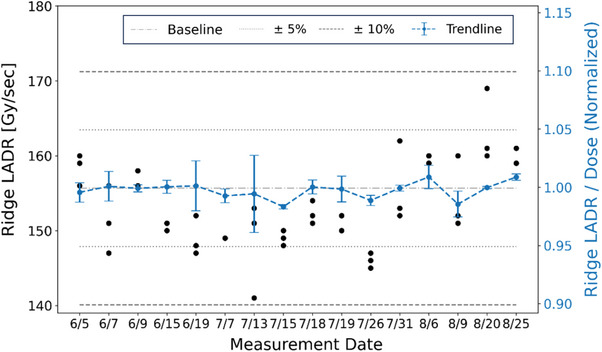
Trend analysis of ridge dose rate (left Y‐axis, black circle) and the normalized ridge LADR (right Y‐Axis, blue dash curve) with respect to absolute dose, presented with error bars indicating one standard deviation.
Official websites use .gov
A
.gov website belongs to an official
government organization in the United States.
Secure .gov websites use HTTPS
A lock (
) or https:// means you've safely
connected to the .gov website. Share sensitive
information only on official, secure websites.
Trend analysis of ridge dose rate (left Y‐axis, black circle) and the normalized ridge LADR (right Y‐Axis, blue dash curve) with respect to absolute dose, presented with error bars indicating one standard deviation.