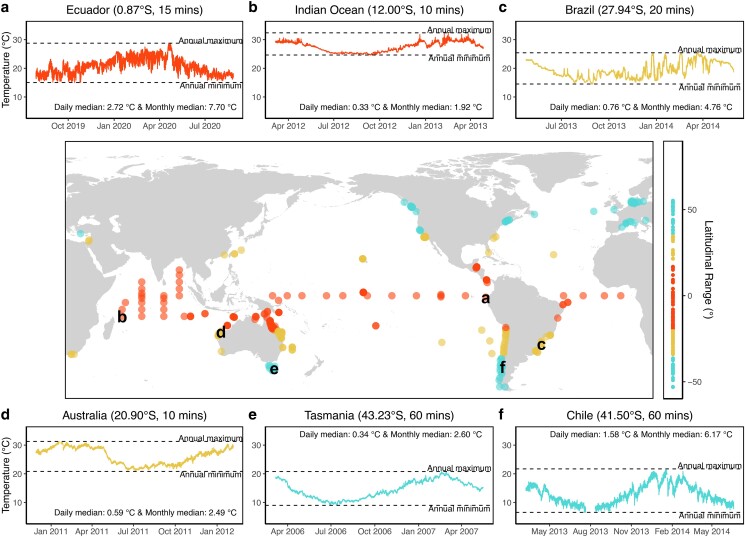
Fig. 1.
Distribution of the 492 high frequency temperature time series used in this study. 169 time series are from tropical regions, 179 from subtropical, and 144 from temperate regions. Insets a)–f) correspond to the temperature time series at the locations shown by the respective letters. These sample time series help to visualize the higher temporal variability of certain locations at the shorter temporal windows. For instance, insets a) and f) both show very high temperature variability [a) tropical Ecuador (2.72°C diurnal median, 7.70°C monthly median) and f) temperate Chile (1.58°C diurnal median, 6.17°C monthly median)], even though inset a) is from tropical regions. The numbers between brackets in the title of each inset indicate the latitude and the measurement frequency of the respective time series. The median temperature ranges over the diurnal and monthly temporal windows are also shown for each inset. The y-axes of all six insets have the same range, for comparability. Additional examples of these time series are shown in SI Appendix, Figs. S6 to S8.

