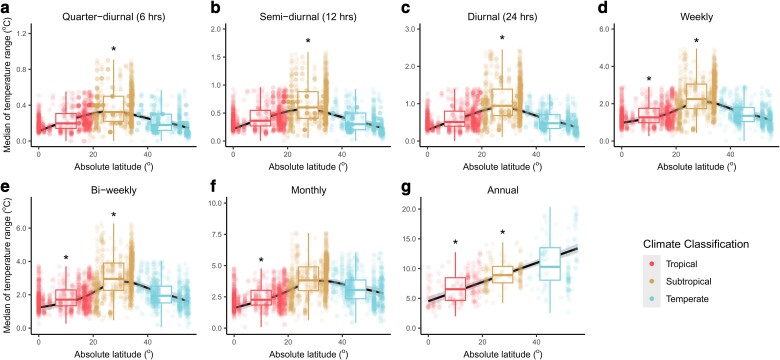
Fig. 2.
Median of the temperature range over seven different temporal windows as a function of the absolute latitude. The median temperature range for seven temporal windows: quarter-diurnal (a, n = 3,063), semi-diurnal (b, n = 3,066), diurnal (c, n = 3,035), weekly (d, n = 3,034), bi-weekly (e, n = 3,038), monthly (f, n = 3,035), and annual (g, n = 479). Dots represent the computed median temperature ranges over their respective temporal windows and are colored according to three climate classifications. The trends across absolute latitude are visualized using GAMM, as represented by the black lines, with the gray shadings representing the 95% CIs. Asterisks indicate that the Bayesian models showed strong evidence (i.e. the 0.95 credible intervals do not include zero) that tropical and/or subtropical regions differed from temperate regions. In both the GAMM and Bayesian models, “plot_id” was nested within “spatial_blocks” for all temporal windows (a–f) except for the annual time span whereby “spatial_blocks” was the only random effect specified (g) (see Materials and methods for more details). The boxplots show the medians (thick central lines) and the quartiles of the data binned under each climate region. Note that the y-axes of the boxes have different ranges. Sensitivity tests were performed to ensure that the results are robust (see SI Appendix, Figs. S1 to S3 and S5).

