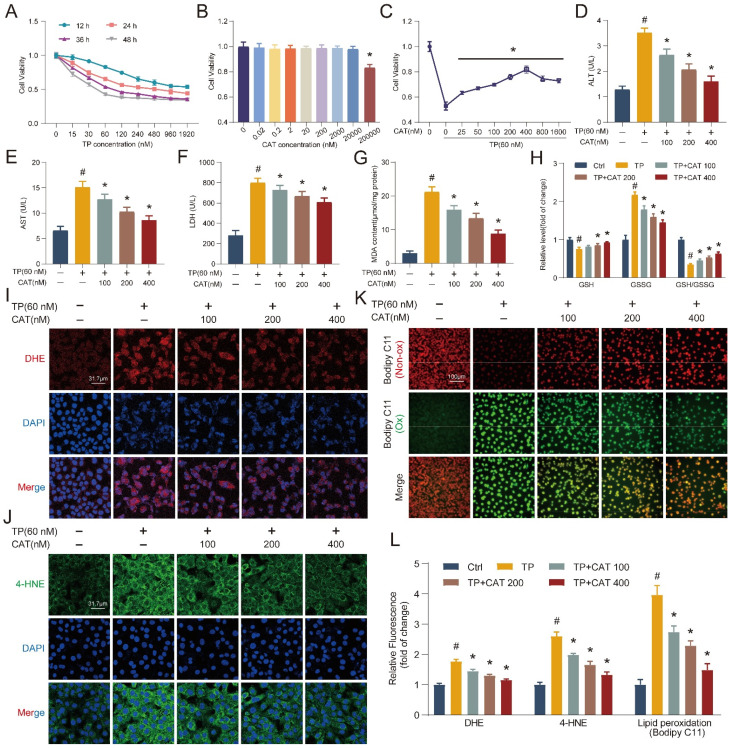
Figure 2.
Catalpol (CAT) suppressed triptolide (TP) induced damage in hepatocytes. (A-C) CCK8 assay. (D-F) AML12 cells culture supernatant ALT, AST and LDH levels. (G) MDA content. (H) Relative concentrations of GSH, GSSG and GSH/GSSG ratio measured in AML12 cells. (I) Representative DHE fluorescence staining of AML12 cells. Scale bar, 31.7 μm. (J) Immunofluorescence staining of AML12 cells using antibody against 4-HNE. Scale bar, 31.7 μm. (K) Bodipy C11 staining of AML12 cells. Scale bar, 100 μm. (L) Relative quantification of DHE, 4-HNE and Bodipy C11 fluorescence images. Data are expressed as mean ± SD (n = 4); #P < 0.05 versus Ctrl, *P < 0.05 versus TP.

