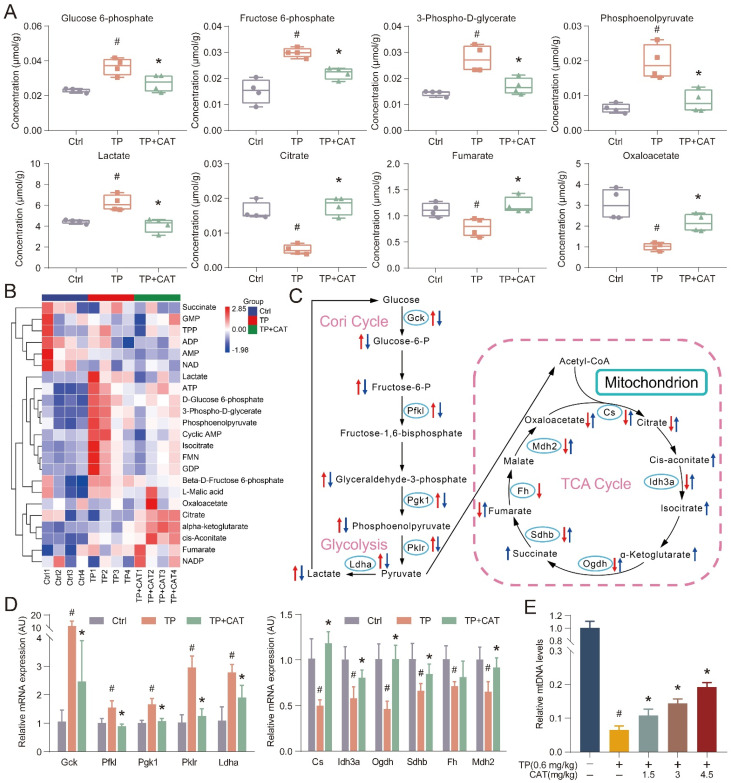
Figure 3.
Catalpol (CAT) improved triptolide (TP) induced energy metabolism disorder in the liver. (A) Box plots of some significantly altered hepatic metabolites in three groups (Ctrl, TP and TP + CAT groups). (B) The hierarchical cluster analysis (HCA) presents a differentiation in the abundance of energy metabolites across the various groups. Within the heatmap, a more intense red denotes a higher level, while a deeper blue suggests a lower concentration. (C) The influence of CAT on TP-induced energy metabolic dysfunctions in the liver. Comparisons to the Ctrl group show that alterations in metabolites in the TP group are marked with a red arrow. Inversely, changes in the TP + CAT group relative to the TP group are represented with blue. An ascending arrow denotes a substantial escalation (P < 0.05), whilst a descending arrow indicates a noteworthy reduction (P < 0.05). (D) Comparative mRNA expression levels tied to energy metabolism in the livers of the three separate groups. (E) Relative mtDNA levels. Data are expressed as mean ± SD (n = 4); #P < 0.05 versus Ctrl, *P < 0.05 versus TP.

