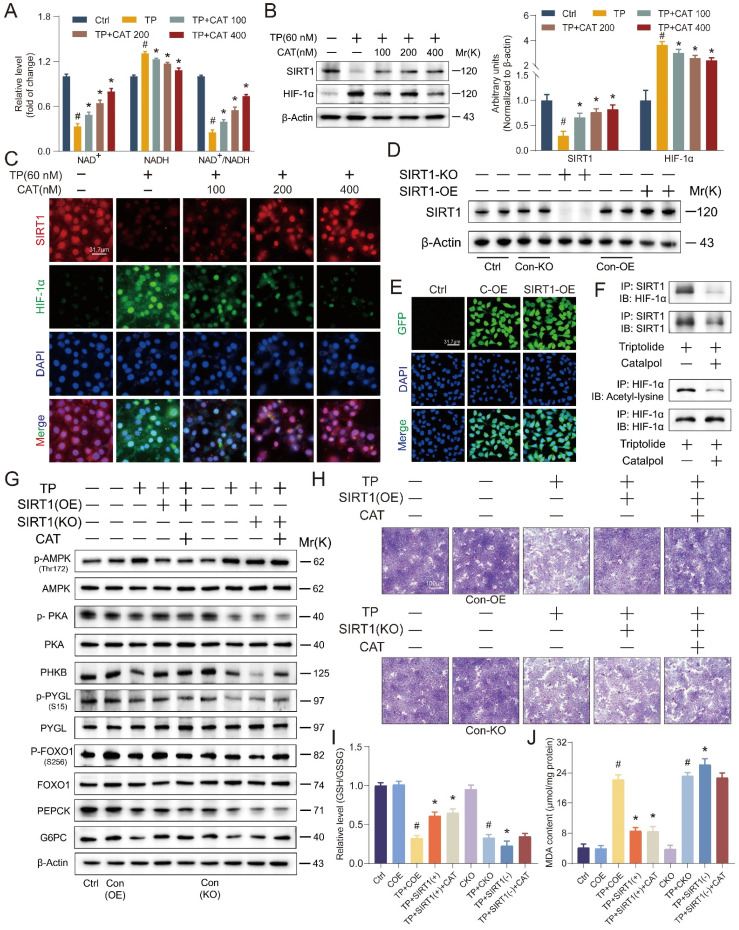
Figure 6.
SIRT1/HIF-1α was the target of catalpol (CAT) and the beneficial effects of CAT were influenced by the overexpression or knockout of SIRT1 in vitro. (A) The relative concentrations of NAD+, NADH and NAD+/NADH ratio measured in AML12 cells. (B) Western blot analysis of SIRT1 and HIF-1α expression from AML12 cells. (C) Immunofluorescence staining of AML12 cells using antibodies against SIRT1 and HIF-1α. Scale bar, 31.7 μm. (D) SIRT1 protein expression of transfected cells. (E) Transfection results of AML12 cells. Scale bar, 31.7 μm. (F) Co-immunoprecipitation was done using equal protein quantities with either SIRT1 antibody or HIF-1α antibody, followed by immunoblotting procedure using antibodies against SIRT1, HIF-1α or Acetyl-lysine, illustrating the impact of TP and CAT. (G) The levels of proteins associated with glycogenolysis and gluconeogenesis in the transfected cells. (H) Microphotograph of transfected cells stained with PAS. Scale bar, 100 μm. (I) Relative determination of GSH/GSSG ratio in transfected cells. (J) MDA content of transfected cells. Data are expressed as mean ± SD (n = 3); #P < 0.05 versus Ctrl, COE or CKO, *P < 0.05 versus TP, TP + COE or TP + CKO.

