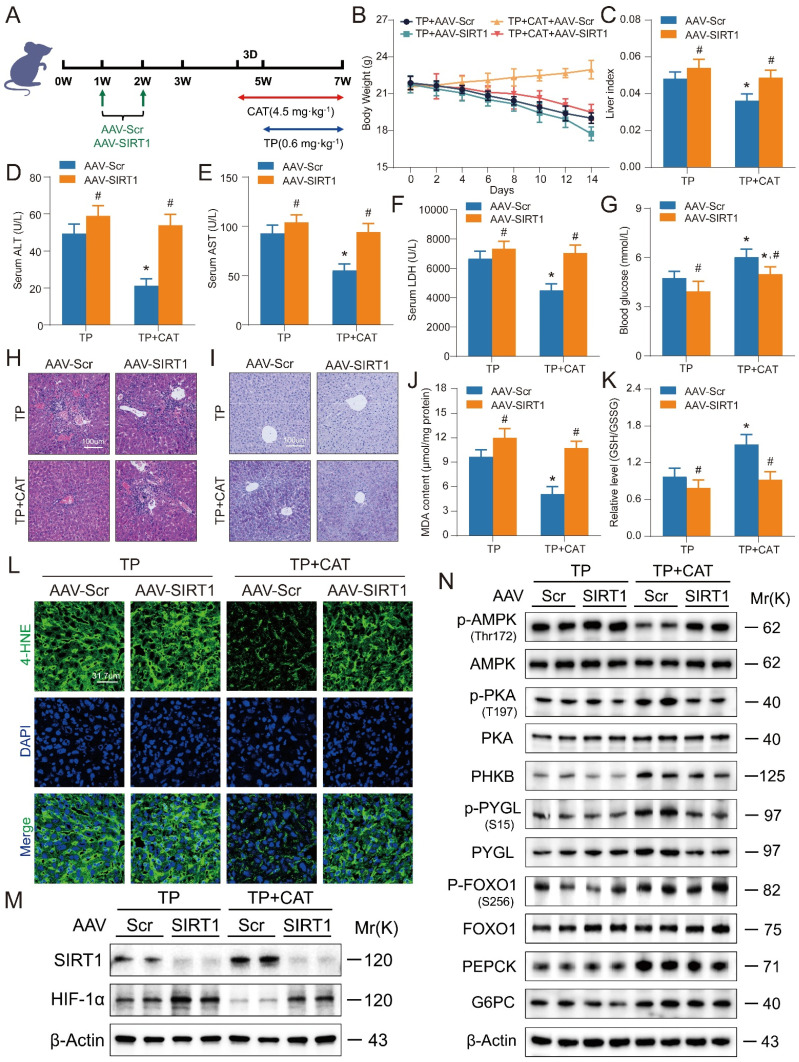
Figure 7.
Liver-specific SIRT1 knockout aggravated triptolide (TP) induced liver injury and weakened the beneficial effects of catalpol (CAT). (A) Experimental flow chart. (B) Body weight. (C) Liver index. (D-F) Serum ALT, AST and LDH levels. (G) Blood glucose levels. (H) Microphotograph of H&E-stained sections of liver tissues. Scale bar, 31.7 μm. (I) Microphotograph of PAS-stained sections of liver tissues. Scale bar, 31.7 μm. (J) MDA content. (K) Relative determination of GSH/GSSG ratio in liver tissues. (L) Immunofluorescence staining of liver sections using antibody against 4-HNE. Scale bar, 31.7 μm. (M) The protein expression levels of SIRT1 and HIF-1α. (N) The expression levels of glycogenolysis and gluconeogenesis related proteins. Data are expressed as mean ± SD (n = 6); An “*” indicates significant difference between TP and TP + CAT groups (P < 0.05). A “#” indicates significant difference between AAV-Scr and AAV-SIRT1 in either TP or TP + CAT groups (P < 0.05).

