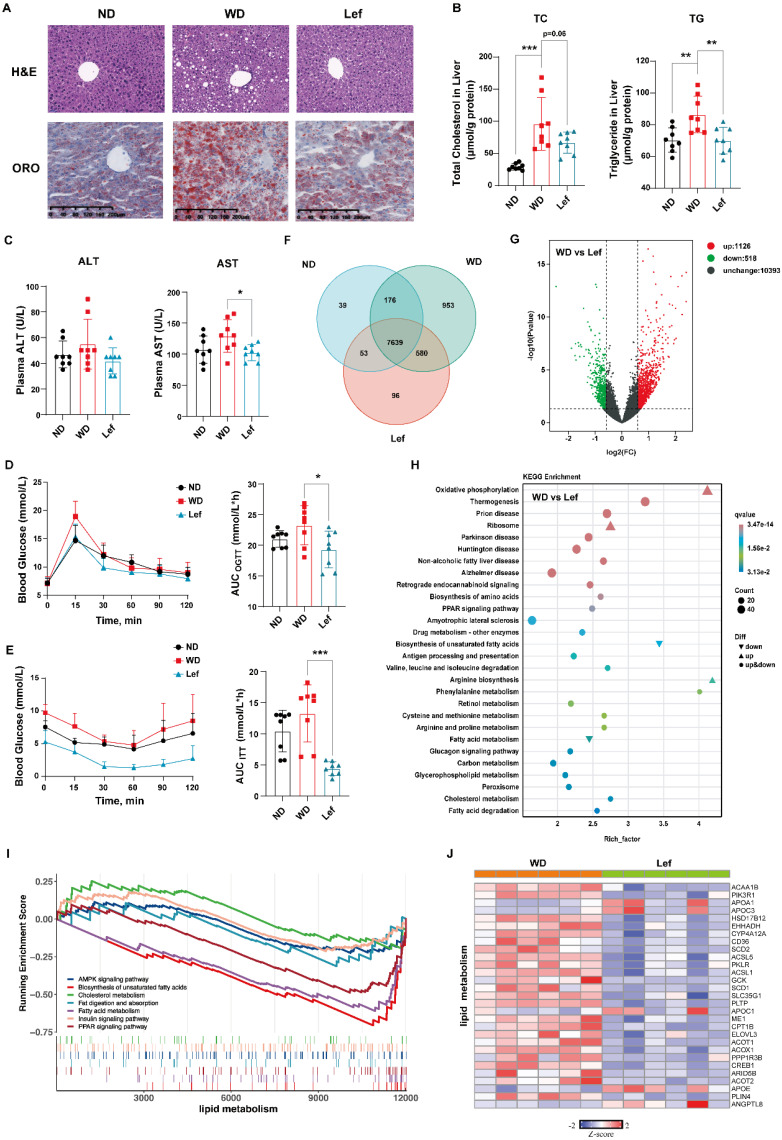
Figure 2.
Leflunomide treatment improved lipid and glucose metabolism in WD-fed ApoE-/- mice. (A) The respective images of the H&E and ORO-stained section of the liver in the ND, WD, and leflunomide treatment (named Lef group) group ApoE-/- mice. Scale bar = 200 μm, n = 6 per group. (B) The TC and TG levels in the liver of the ND, WD, and Lef groups. n = 8 per group. (C) The plasma ALT and AST levels. n = 16 per group. (D-E) The blood glucose levels at a certain time point were detected during the OGTT and ITT and the areas under the curve (AUC) were calculated respectively. (F) Venn diagram based on RNA-Seq results from the livers of ND, WD, and Lef groups. n = 6 per group. (G) Volcano map of differentially expressed genes (DGEs) (fold change ≥ 1.5 and P < 0.01, WD vs Lef) in RNA-Seq results from the livers of WD and Lef groups. n = 6 per group. (H) KEGG enrichment analysis DGEs between WD and Lef group. n = 6 per group. (I) GSEA enrichment results show the pathways related to lipid metabolism in the RNA-Seq dataset. n = 6 per group. (J) Heatmap of lipid metabolism-related DGEs profiles based on the RNA-seq data set. P < 0.01, n = 6 per group. One-way ANOVA analysis was performed: *P < 0.05, ** P < 0.01, *** P < 0.001.

