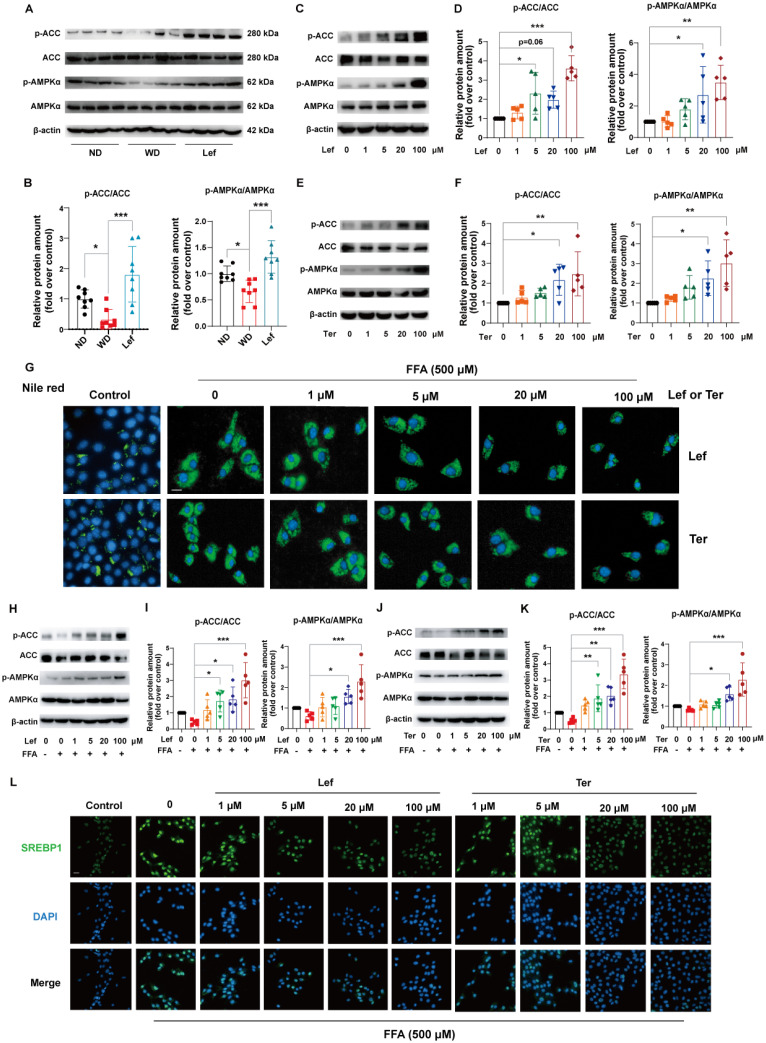
Figure 3.
Leflunomide and Teriflunomide activate the AMPK pathway and alleviate lipid accumulation in FFA-stimulated AML12 cells. (A-B) Western blot analysis of the p-AMPKα, AMPKα, p-ACC, and ACC in livers of ApoE-/- mice in ND, WD, and leflunomide treatment (named Lef) group. Representative immunoblots are shown (A) and the images were quantitatively analyzed with Image J software (B), and then the ratio of p-AMPKα/AMPKα and p-ACC/ACC was calculated (B). n = 8 per group. (C-F) AML12 cells were treated with leflunomide (0, 1, 5, 20, 100 μM) (C-D) or teriflunomide (0, 1, 5, 20, 100 μM) (E-F) for 30 min (0, 1, 5, 20, 100 μM). The protein levels of p-AMPKα, AMPKα, p-ACC, and ACC were detected and the ratio of p-AMPKα/AMPKα and p-ACC/ACC was quantitatively analyzed. n = 5. (G-L) AML12 cells were treated with or without FFA (500 μM, PA: OA = 1:2) and leflunomide (0, 1, 5, 20, 100 μM) or teriflunomide (0, 1, 5, 20, 100 μM) simultaneously for 18 h. (G) The respective images of Nile red staining. Scale bar = 20 μm. n = 5. (H-K) Representative immunoblot images quantitative analysis of the ratio of p-AMPKα/AMPKα and p-ACC/ACC. n = 5. (L) Representative immunofluorescent images of SREBP1 (green) and the cell nucleus stained with DAPI (blue). Scale bar = 20 μm. n = 5. Leflunomide is abbreviated as Lef, and teriflunomide is abbreviated as Ter in all in vitro assays. One-way ANOVA analysis was performed: *P < 0.05, ** P < 0.01, *** P < 0.001.

